
- Start >
- Rivers >
- Discharge >
- Obere Donau >
- Achsheim >
- Chart of year

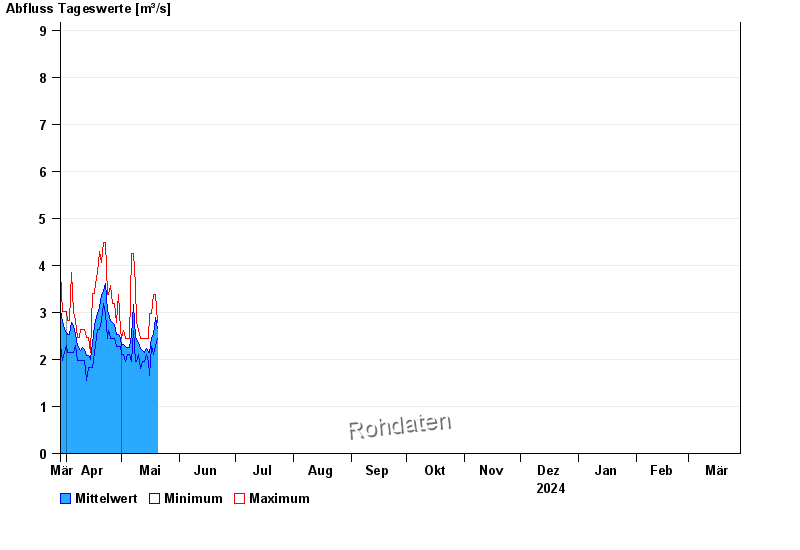
Chart of year Achsheim / Schmutter
Discharge from 29.03.2024 to 28.03.2025
- HQ1 23 m³/s
- HQ2 30 m³/s
- HQ5 43 m³/s
- HQ10 53 m³/s
- HQ20 62 m³/s
- HQ50 77 m³/s
- HQ100 88 m³/s
| Date | Mean value [m³/s] | Maximum [m³/s] | Minimum [m³/s] |
|---|---|---|---|
| 09.05.2024 | 2.58 | 2.79 | 2.27 |
| 08.05.2024 | 2.48 | 3.58 | 2.11 |
| 07.05.2024 | 3.17 | 4.25 | 2.61 |
| 06.05.2024 | 2.5 | 4.25 | 1.95 |
| 05.05.2024 | 2.25 | 2.44 | 2.11 |
| 04.05.2024 | 2.26 | 2.44 | 2.11 |
| 03.05.2024 | 2.27 | 2.44 | 1.95 |
© Bayerisches Landesamt für Umwelt 2024