
- Start >
- Rivers >
- Discharge >
- Obere Donau >
- Achsheim >
- Chart of year

Chart of year Achsheim / Schmutter
Discharge from 19.05.2021 to 18.05.2022
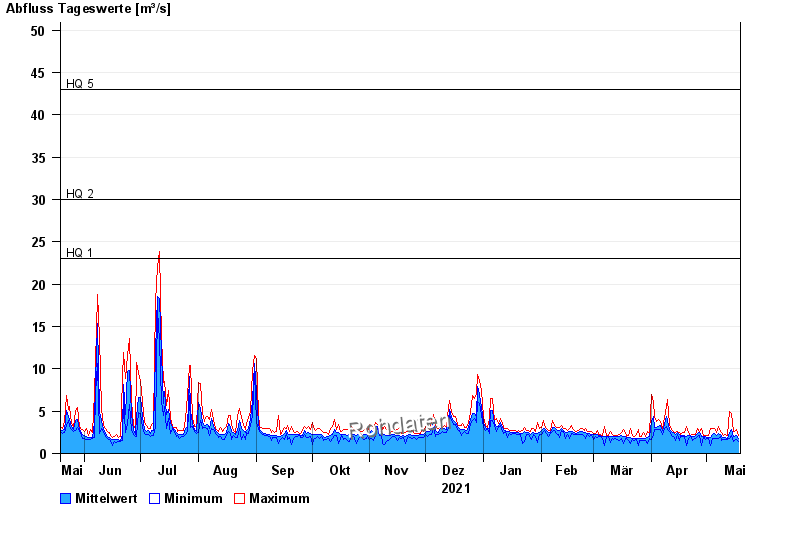
- HQ1 23 m³/s
- HQ2 30 m³/s
- HQ5 43 m³/s
- HQ10 53 m³/s
- HQ20 62 m³/s
- HQ50 77 m³/s
- HQ100 88 m³/s
| Date | Mean value [m³/s] | Maximum [m³/s] | Minimum [m³/s] |
|---|---|---|---|
| 18.05.2022 | 1.79 | 2.11 | 1.4 |
| 17.05.2022 | 2.11 | 2.8 | 1.66 |
| 16.05.2022 | 1.97 | 2.61 | 1.52 |
| 15.05.2022 | 1.97 | 2.61 | 1.4 |
| 14.05.2022 | 2.81 | 4.73 | 2.11 |
| 13.05.2022 | 2.53 | 4.99 | 1.81 |
| 12.05.2022 | 1.79 | 2.11 | 1.66 |
© Bayerisches Landesamt für Umwelt 2024