

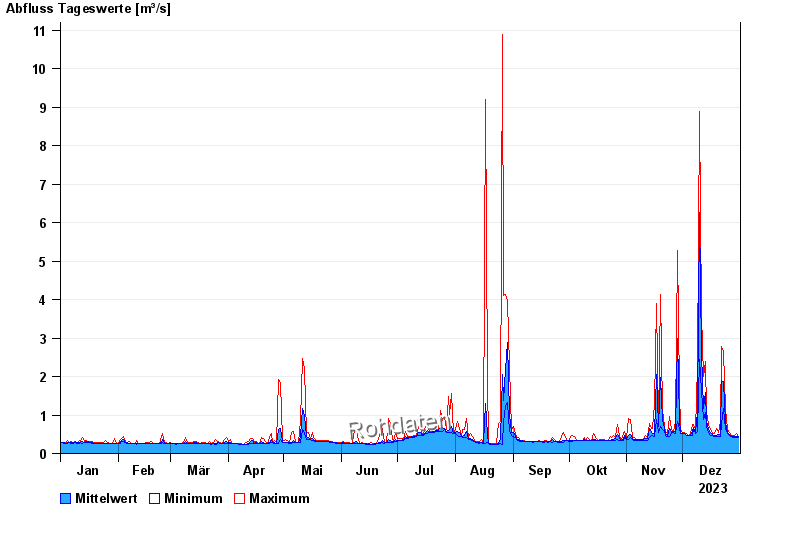
Chart of year Wolnzach / Wolnzach
Discharge from 01.01.2023 to 31.12.2023
 Für diesen Pegel sind keine -Sommer hinterlegt.
| Date | Mean value [m³/s] | Maximum [m³/s] | Minimum [m³/s] |
|---|---|---|---|
| 31.12.2023 | 0.438 | 0.44 | 0.406 |
| 30.12.2023 | 0.441 | 0.51 | 0.406 |
| 29.12.2023 | 0.439 | 0.474 | 0.406 |
| 28.12.2023 | 0.443 | 0.474 | 0.406 |
| 27.12.2023 | 0.469 | 0.474 | 0.44 |
| 26.12.2023 | 0.496 | 0.546 | 0.474 |
| 25.12.2023 | 0.557 | 0.621 | 0.51 |
© Bayerisches Landesamt für Umwelt 2024