

Chart of year Weilheim / Ammer
Discharge from 30.11.2020 to 29.11.2021
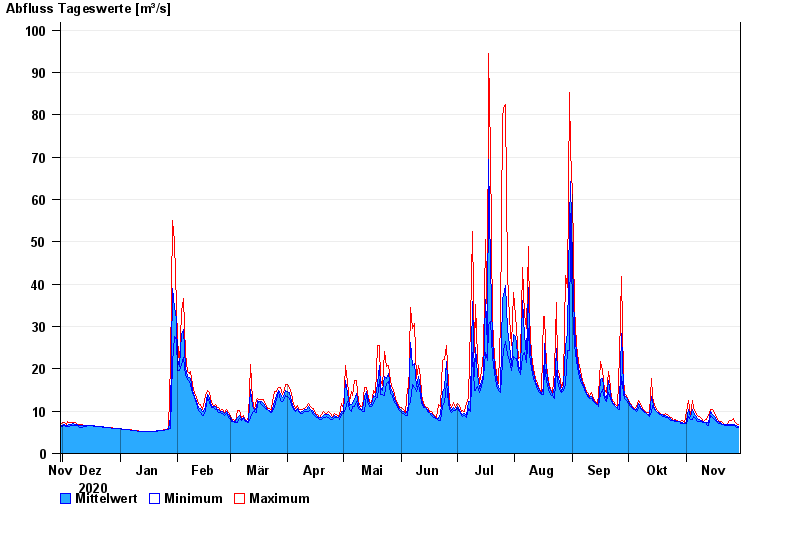
| Date | Mean value [m³/s] | Maximum [m³/s] | Minimum [m³/s] |
|---|---|---|---|
| 29.11.2021 | 6.47 | 6.9 | 6.26 |
| 28.11.2021 | 6.61 | 7.2 | 6.26 |
| 27.11.2021 | 6.84 | 7.52 | 6.55 |
| 26.11.2021 | 6.83 | 8.19 | 6.54 |
| 25.11.2021 | 6.81 | 7.83 | 6.53 |
| 24.11.2021 | 6.9 | 7.82 | 6.51 |
| 23.11.2021 | 6.8 | 6.83 | 6.51 |
© Bayerisches Landesamt für Umwelt 2024