

Chart of year Weilheim / Ammer
Discharge from 30.11.2021 to 29.11.2022
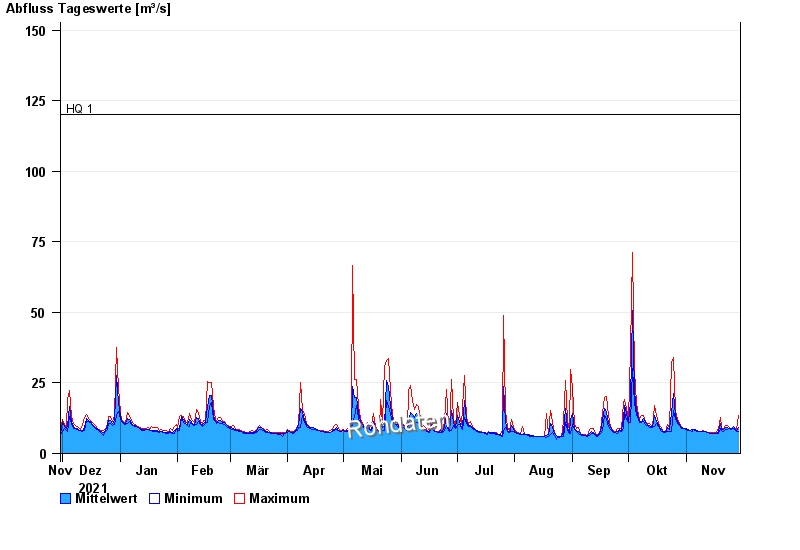
- HQ1 120 m³/s
- HQ2 155 m³/s
- HQ5 210 m³/s
- HQ10 260 m³/s
- HQ20 315 m³/s
- HQ50 410 m³/s
- HQ100 480 m³/s
| Date | Mean value [m³/s] | Maximum [m³/s] | Minimum [m³/s] |
|---|---|---|---|
| 29.11.2022 | 9.13 | 13.5 | 7.96 |
| 28.11.2022 | 8.32 | 8.66 | 7.96 |
| 27.11.2022 | 8.98 | 9.36 | 8.66 |
| 26.11.2022 | 9.52 | 9.65 | 9.01 |
| 25.11.2022 | 8.82 | 9.01 | 8.66 |
| 24.11.2022 | 9.02 | 9.36 | 9.01 |
| 23.11.2022 | 9.36 | 10 | 8.66 |
© Bayerisches Landesamt für Umwelt 2024