

Chart of year Weilheim / Ammer
Discharge from 30.11.2019 to 29.11.2020
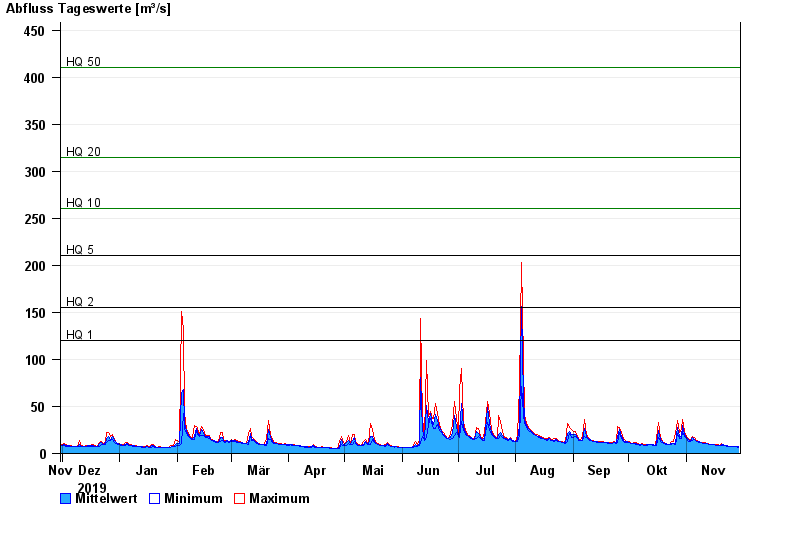
- HQ1 120 m³/s
- HQ2 155 m³/s
- HQ5 210 m³/s
- HQ10 260 m³/s
- HQ20 315 m³/s
- HQ50 410 m³/s
- HQ100 480 m³/s
| Date | Mean value [m³/s] | Maximum [m³/s] | Minimum [m³/s] |
|---|---|---|---|
| 29.11.2020 | 6.91 | 6.92 | 6.61 |
| 28.11.2020 | 7.03 | 7.25 | 6.92 |
| 27.11.2020 | 7.25 | 7.25 | 6.93 |
| 26.11.2020 | 7.41 | 7.59 | 7.25 |
| 25.11.2020 | 7.64 | 7.93 | 7.59 |
| 24.11.2020 | 7.9 | 7.93 | 7.59 |
| 23.11.2020 | 8.1 | 8.28 | 7.93 |
© Bayerisches Landesamt für Umwelt 2024