

Chart of total period Weilheim / Ammer
Discharge from 01.11.1925 to 10.05.2024
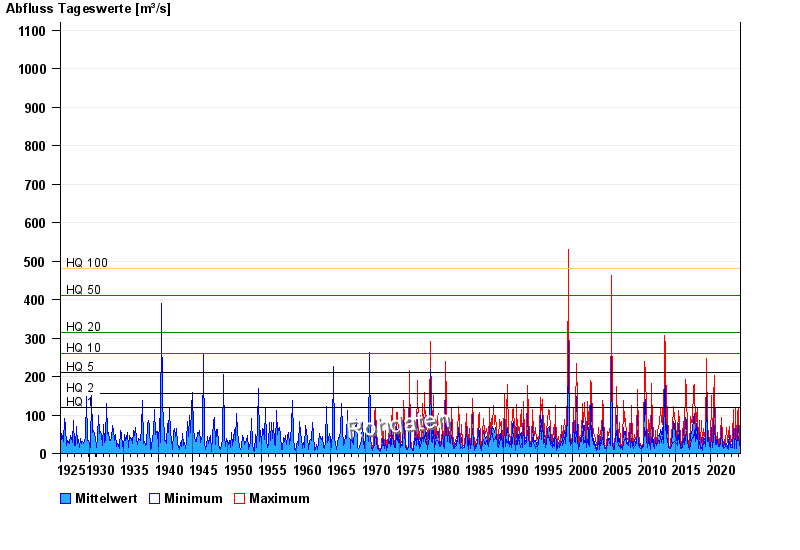
- HQ1 120 m³/s
- HQ2 155 m³/s
- HQ5 210 m³/s
- HQ10 260 m³/s
- HQ20 315 m³/s
- HQ50 410 m³/s
- HQ100 480 m³/s
| Date | Mean value [m³/s] | Maximum [m³/s] | Minimum [m³/s] |
|---|---|---|---|
| 10.05.2024 | 18.3 | 19.9 | 17.2 |
| 09.05.2024 | 23.8 | 28.7 | 19.9 |
| 08.05.2024 | 29 | 42.4 | 13 |
| 07.05.2024 | 13.3 | 14.2 | 12.6 |
| 06.05.2024 | 13 | 15.1 | 12.2 |
| 05.05.2024 | 12.8 | 13 | 12.2 |
| 04.05.2024 | 13.5 | 13.8 | 13 |
© Bayerisches Landesamt für Umwelt 2024