
- Start >
- Rivers >
- Discharge >
- Isar >
- Weichselbaum >
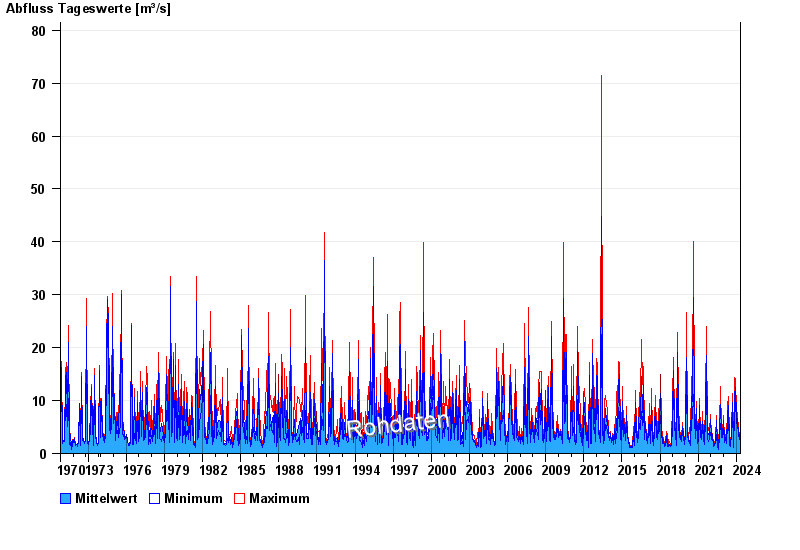
- Chart of total period

Chart of total period Weichselbaum / Murn
Discharge from 01.11.1970 to 27.04.2024
| Date | Mean value [m³/s] | Maximum [m³/s] | Minimum [m³/s] |
|---|---|---|---|
| 27.04.2024 | 2.51 | 2.51 | 2.51 |
| 26.04.2024 | 2.73 | 2.95 | 2.51 |
| 25.04.2024 | 3.1 | 3.24 | 2.95 |
| 24.04.2024 | 3.35 | 3.39 | 3.24 |
| 23.04.2024 | 3.38 | 3.83 | 3.1 |
| 22.04.2024 | 4.34 | 4.67 | 3.83 |
| 21.04.2024 | 3.7 | 4.67 | 3.24 |
© Bayerisches Landesamt für Umwelt 2024