

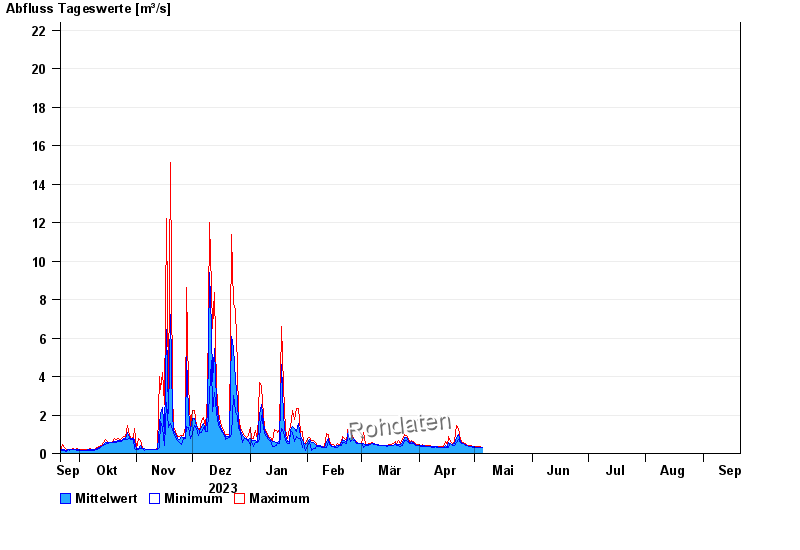
Chart of year Weg / Isen
Discharge from 21.09.2023 to 20.09.2024
- 01.08.1991 Abfluss: 52,8 m³/s
- 04.08.1973 Abfluss: 47,2 m³/s
- 15.02.1990 Abfluss: 45,3 m³/s
- 03.08.1987 Abfluss: 42,6 m³/s
- 02.06.1995 Abfluss: 41,4 m³/s
| Date | Mean value [m³/s] | Maximum [m³/s] | Minimum [m³/s] |
|---|---|---|---|
| 09.05.2024 | 0.485 | 0.503 | 0.441 |
| 08.05.2024 | 0.455 | 0.539 | 0.369 |
| 07.05.2024 | 0.49 | 0.986 | 0.369 |
| 06.05.2024 | 0.502 | 1.8 | 0.303 |
| 05.05.2024 | 0.326 | 0.334 | 0.318 |
| 04.05.2024 | 0.335 | 0.351 | 0.318 |
| 03.05.2024 | 0.332 | 0.369 | 0.318 |
© Bayerisches Landesamt für Umwelt 2024