
- Start >
- Rivers >
- Discharge >
- Isar >
- Wallersdorf >
- Chart of year

Chart of year Wallersdorf / Reißingerbach
Discharge from 01.01.2024 to 26.04.2024
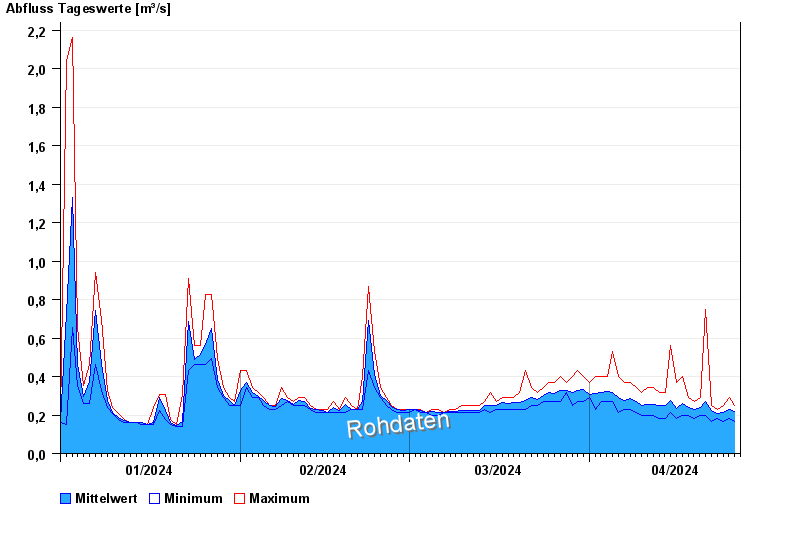
| Date | Mean value [m³/s] | Maximum [m³/s] | Minimum [m³/s] |
|---|---|---|---|
| 26.04.2024 | 0.219 | 0.231 | 0.213 |
| 25.04.2024 | 0.228 | 0.293 | 0.181 |
| 24.04.2024 | 0.215 | 0.251 | 0.166 |
| 23.04.2024 | 0.207 | 0.231 | 0.181 |
| 22.04.2024 | 0.223 | 0.251 | 0.166 |
| 21.04.2024 | 0.269 | 0.748 | 0.196 |
| 20.04.2024 | 0.237 | 0.293 | 0.196 |
© Bayerisches Landesamt für Umwelt 2024