
- Start >
- Rivers >
- Discharge >
- Isar >
- Wallersdorf >
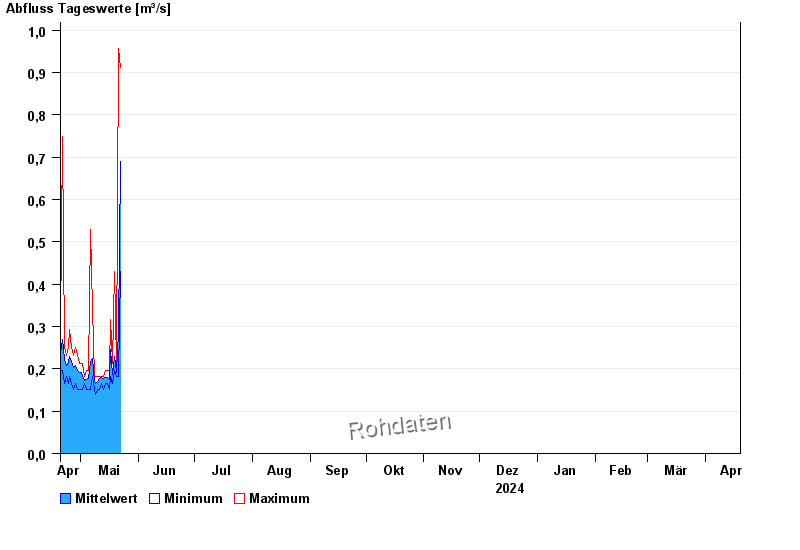
- Chart of year

Chart of year Wallersdorf / Reißingerbach
Discharge from 20.04.2024 to 19.04.2025
- 14.01.2011 Abfluss: 13,6 m³/s
- 03.06.2013 Abfluss: 13,1 m³/s
- 16.02.2006 Abfluss: 11,9 m³/s
- 04.08.1991 Abfluss: 10,8 m³/s
- 11.11.2002 Abfluss: 10,6 m³/s
| Date | Mean value [m³/s] | Maximum [m³/s] | Minimum [m³/s] |
|---|---|---|---|
| 02.05.2024 | 0.196 | 0.196 | 0.196 |
| 01.05.2024 | 0.191 | 0.213 | 0.152 |
| 30.04.2024 | 0.192 | 0.213 | 0.152 |
| 29.04.2024 | 0.197 | 0.231 | 0.152 |
| 28.04.2024 | 0.207 | 0.251 | 0.166 |
| 27.04.2024 | 0.202 | 0.231 | 0.152 |
| 26.04.2024 | 0.218 | 0.251 | 0.166 |
© Bayerisches Landesamt für Umwelt 2024