

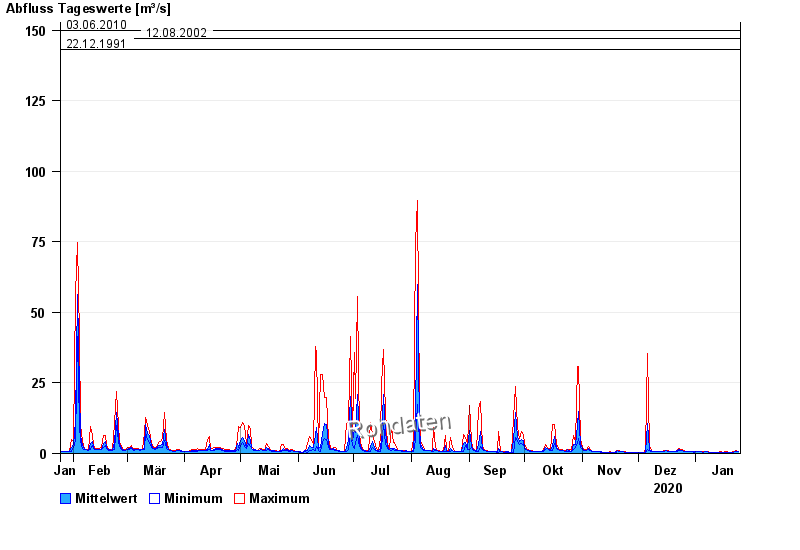
Chart of year Walchen / Walchen
Discharge from 25.01.2020 to 24.01.2021
- 23.08.2005 Abfluss: 210 m³/s
- 22.05.1999 Abfluss: 199 m³/s
- 03.06.2010 Abfluss: 150 m³/s
- 12.08.2002 Abfluss: 147 m³/s
- 22.12.1991 Abfluss: 143 m³/s
| Date | Mean value [m³/s] | Maximum [m³/s] | Minimum [m³/s] |
|---|---|---|---|
| 24.01.2021 | 0.772 | 0.845 | 0.719 |
| 23.01.2021 | 0.839 | 0.912 | 0.779 |
| 22.01.2021 | 0.64 | 0.779 | 0.551 |
| 21.01.2021 | 0.511 | 0.551 | 0.499 |
| 20.01.2021 | 0.499 | 0.499 | 0.499 |
| 19.01.2021 | 0.499 | 0.499 | 0.499 |
| 18.01.2021 | 0.503 | 0.551 | 0.499 |
© Bayerisches Landesamt für Umwelt 2024