

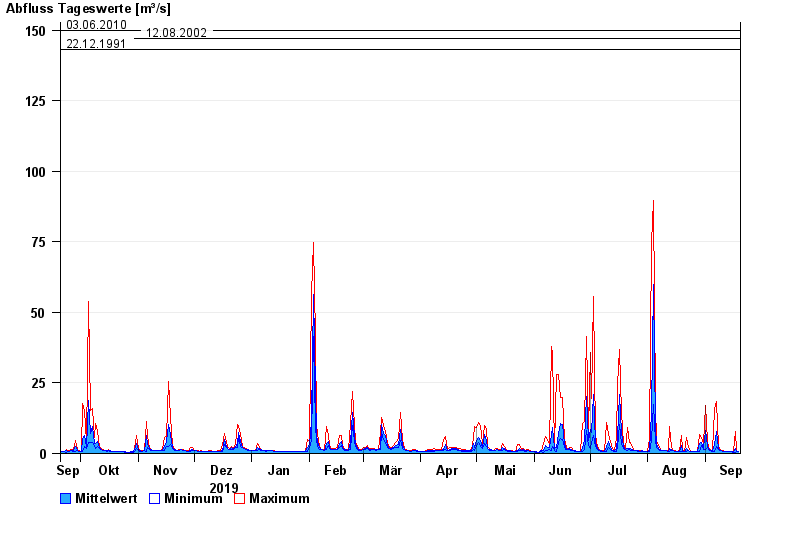
Chart of year Walchen / Walchen
Discharge from 20.09.2019 to 19.09.2020
- 23.08.2005 Abfluss: 210 m³/s
- 22.05.1999 Abfluss: 199 m³/s
- 03.06.2010 Abfluss: 150 m³/s
- 12.08.2002 Abfluss: 147 m³/s
- 22.12.1991 Abfluss: 143 m³/s
| Date | Mean value [m³/s] | Maximum [m³/s] | Minimum [m³/s] |
|---|---|---|---|
| 19.09.2020 | 0.567 | 0.596 | 0.545 |
| 18.09.2020 | 0.695 | 0.882 | 0.596 |
| 17.09.2020 | 1.8 | 7.65 | 0.508 |
| 16.09.2020 | 0.546 | 0.557 | 0.508 |
| 15.09.2020 | 0.582 | 0.61 | 0.557 |
| 14.09.2020 | 0.614 | 0.665 | 0.61 |
| 13.09.2020 | 0.676 | 0.723 | 0.613 |
© Bayerisches Landesamt für Umwelt 2024