

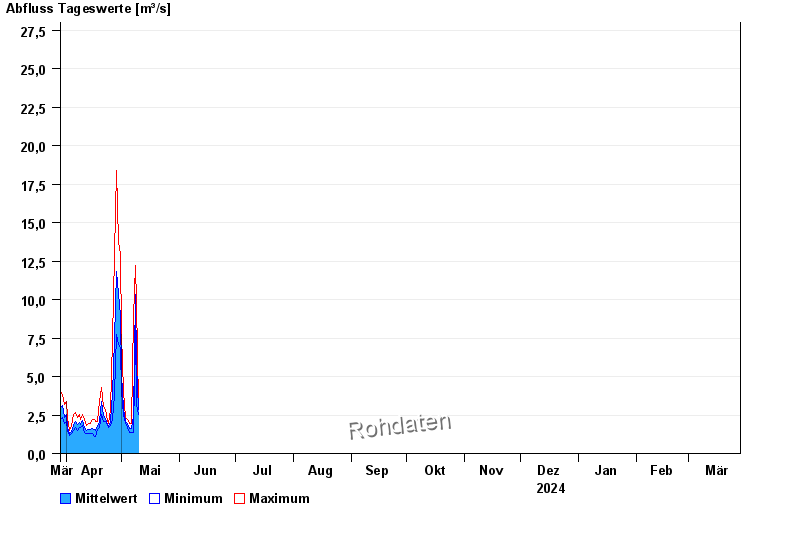
Chart of year Walchen / Walchen
Discharge from 29.03.2024 to 28.03.2025
- 23.08.2005 Abfluss: 210 m³/s
- 22.05.1999 Abfluss: 199 m³/s
- 03.06.2010 Abfluss: 150 m³/s
- 12.08.2002 Abfluss: 147 m³/s
- 22.12.1991 Abfluss: 143 m³/s
| Date | Mean value [m³/s] | Maximum [m³/s] | Minimum [m³/s] |
|---|---|---|---|
| 27.04.2024 | 5.87 | 11.9 | 3.82 |
| 26.04.2024 | 3.93 | 7.39 | 2.2 |
| 25.04.2024 | 2.08 | 2.85 | 1.8 |
| 24.04.2024 | 1.74 | 1.92 | 1.68 |
| 23.04.2024 | 1.88 | 2.06 | 1.8 |
| 22.04.2024 | 2.27 | 2.85 | 2.06 |
| 21.04.2024 | 2.49 | 3.03 | 2.06 |
© Bayerisches Landesamt für Umwelt 2024