
- Start >
- Rivers >
- Discharge >
- Isar >
- Vilsbiburg >
- Chart of year

Chart of year Vilsbiburg / Große Vils
Discharge from 01.01.2024 to 27.04.2024
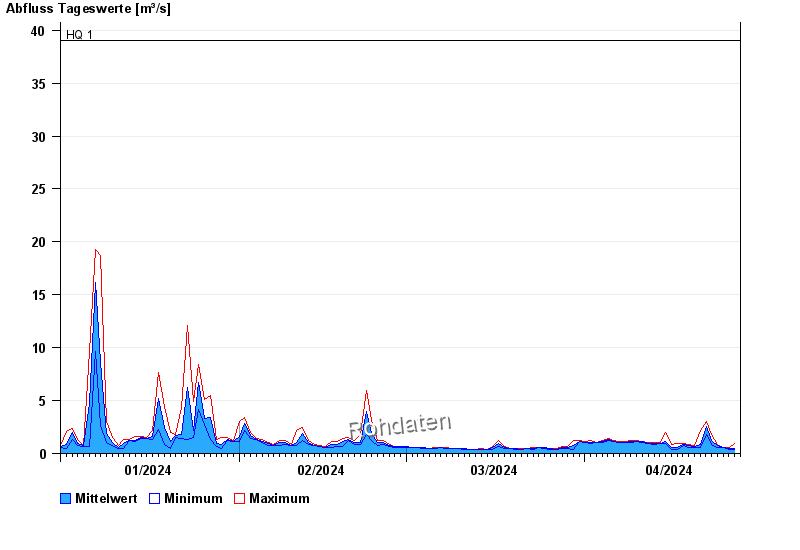
- HQ1 39 m³/s
- HQ2 55 m³/s
- HQ5 80 m³/s
- HQ10 100 m³/s
- HQ20 125 m³/s
- HQ50 165 m³/s
- HQ100 200 m³/s
| Date | Mean value [m³/s] | Maximum [m³/s] | Minimum [m³/s] |
|---|---|---|---|
| 27.04.2024 | 0.388 | 0.389 | 0.375 |
| 26.04.2024 | 0.442 | 0.53 | 0.343 |
| 25.04.2024 | 0.582 | 0.611 | 0.53 |
| 24.04.2024 | 0.72 | 0.892 | 0.611 |
| 23.04.2024 | 1.2 | 1.8 | 0.892 |
| 22.04.2024 | 2.52 | 2.99 | 1.8 |
| 21.04.2024 | 0.861 | 2.13 | 0.611 |
© Bayerisches Landesamt für Umwelt 2024