
- Start >
- Rivers >
- Discharge >
- Isar >
- Vilsbiburg >
- Chart of total period

Chart of total period Vilsbiburg / Große Vils
Discharge from 01.11.1939 to 26.04.2024
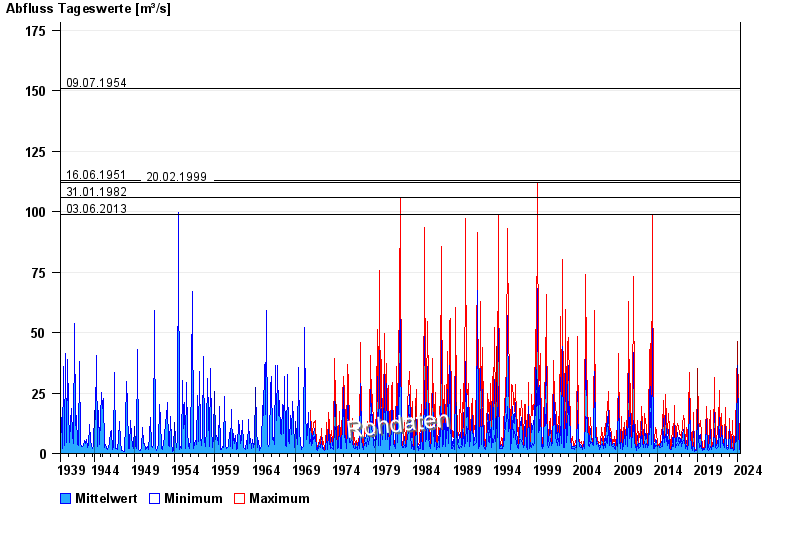
- 09.07.1954 Abfluss: 151 m³/s
- 16.06.1951 Abfluss: 113 m³/s
- 20.02.1999 Abfluss: 112 m³/s
- 31.01.1982 Abfluss: 106 m³/s
- 03.06.2013 Abfluss: 99 m³/s
| Date | Mean value [m³/s] | Maximum [m³/s] | Minimum [m³/s] |
|---|---|---|---|
| 26.04.2024 | 0.499 | 0.53 | 0.485 |
| 25.04.2024 | 0.582 | 0.611 | 0.53 |
| 24.04.2024 | 0.72 | 0.892 | 0.611 |
| 23.04.2024 | 1.2 | 1.8 | 0.892 |
| 22.04.2024 | 2.52 | 2.99 | 1.8 |
| 21.04.2024 | 0.861 | 2.13 | 0.611 |
| 20.04.2024 | 0.639 | 0.714 | 0.583 |
© Bayerisches Landesamt für Umwelt 2024