

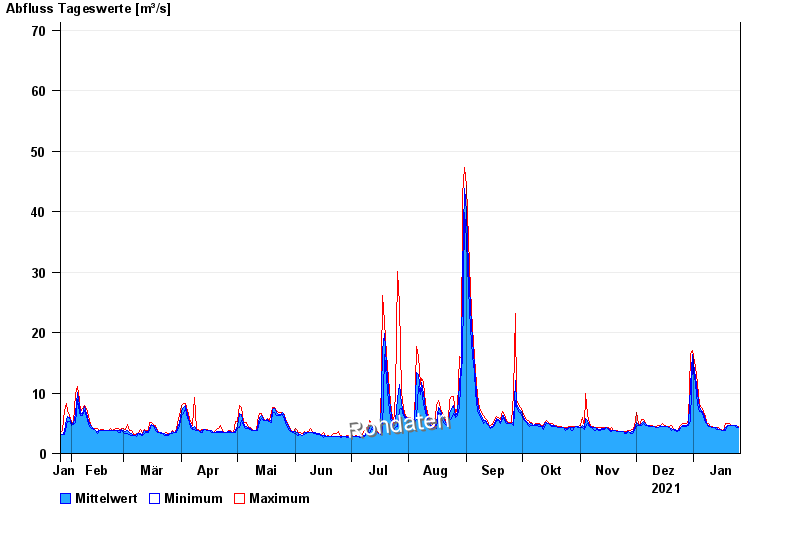
Chart of year Valley / Mangfall
Discharge from 26.01.2021 to 25.01.2022
- 02.06.2013 Abfluss: 157 m³/s
- 23.08.2005 Abfluss: 142 m³/s
- 09.07.1954 Abfluss: 135 m³/s
- 22.05.1999 Abfluss: 125 m³/s
- 23.07.1966 Abfluss: 114 m³/s
| Date | Mean value [m³/s] | Maximum [m³/s] | Minimum [m³/s] |
|---|---|---|---|
| 25.01.2022 | 4.32 | 4.45 | 4.23 |
| 24.01.2022 | 4.55 | 4.68 | 4.23 |
| 23.01.2022 | 4.68 | 4.68 | 4.68 |
| 22.01.2022 | 4.68 | 4.68 | 4.68 |
| 21.01.2022 | 4.68 | 4.68 | 4.68 |
| 20.01.2022 | 4.68 | 4.91 | 4.68 |
| 19.01.2022 | 4.68 | 4.91 | 4.68 |
© Bayerisches Landesamt für Umwelt 2024