

Chart of year Valley / Mangfall
Discharge from 30.03.2024 to 29.03.2025
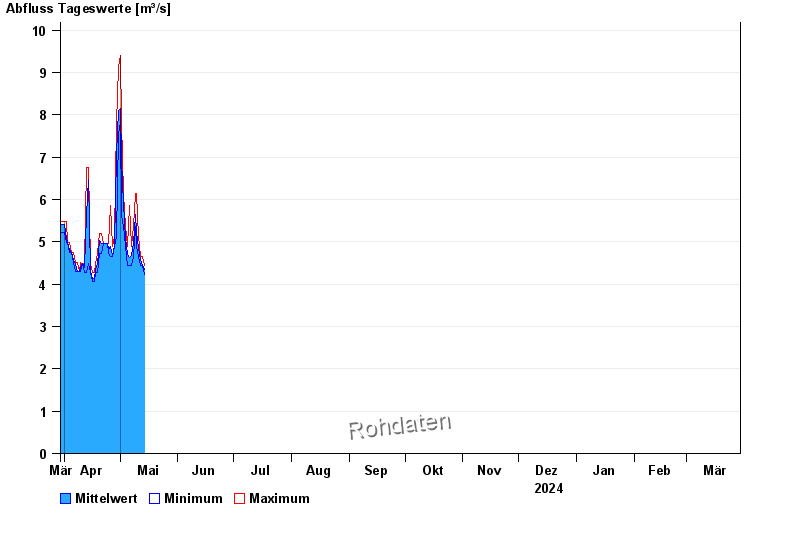
| Date | Mean value [m³/s] | Maximum [m³/s] | Minimum [m³/s] |
|---|---|---|---|
| 28.04.2024 | 4.72 | 4.72 | 4.72 |
| 27.04.2024 | 4.51 | 4.72 | 4.5 |
| 26.04.2024 | 4.72 | 5.69 | 4.5 |
| 25.04.2024 | 4.82 | 4.96 | 4.72 |
| 24.04.2024 | 4.96 | 4.96 | 4.96 |
| 23.04.2024 | 4.96 | 4.96 | 4.96 |
| 22.04.2024 | 4.96 | 4.96 | 4.96 |
© Bayerisches Landesamt für Umwelt 2024