

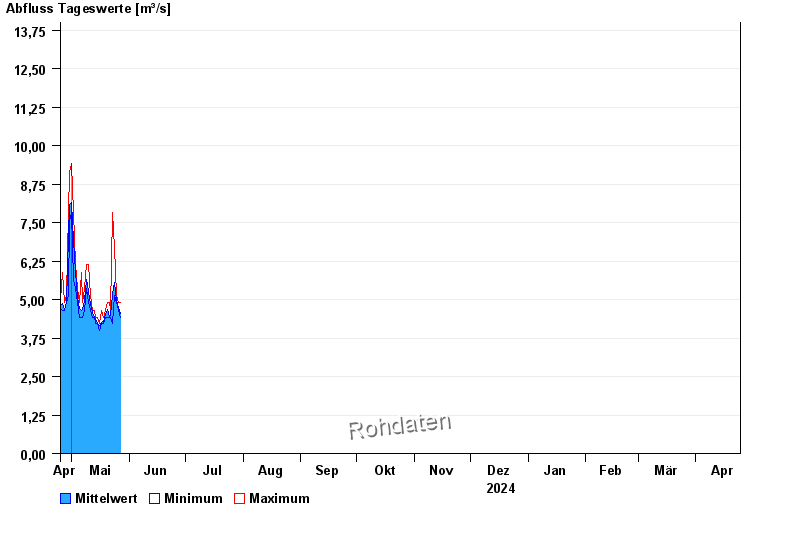
Chart of year Valley / Mangfall
Discharge from 25.04.2024 to 24.04.2025
- 02.06.2013 Abfluss: 157 m³/s
- 23.08.2005 Abfluss: 142 m³/s
- 09.07.1954 Abfluss: 135 m³/s
- 22.05.1999 Abfluss: 125 m³/s
- 23.07.1966 Abfluss: 114 m³/s
| Date | Mean value [m³/s] | Maximum [m³/s] | Minimum [m³/s] |
|---|---|---|---|
| 06.05.2024 | 4.43 | 4.43 | 4.43 |
| 05.05.2024 | 4.71 | 4.89 | 4.43 |
| 04.05.2024 | 5.08 | 5.37 | 4.89 |
| 03.05.2024 | 5.91 | 6.14 | 5.37 |
| 02.05.2024 | 6.93 | 7.83 | 5.62 |
| 01.05.2024 | 8.14 | 9.41 | 7.83 |
| 30.04.2024 | 8.1 | 9.12 | 7.53 |
© Bayerisches Landesamt für Umwelt 2024