

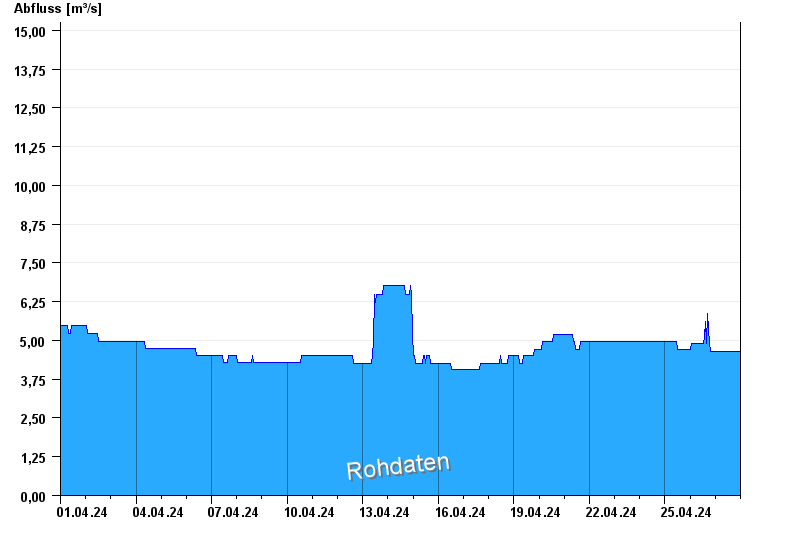
Chart of month Valley / Mangfall
Discharge from 01.04.2024 to 27.04.2024
- HQ1 56 m³/s
- HQ2 66 m³/s
- HQ5 82 m³/s
- HQ10 98 m³/s
- HQ20 115 m³/s
- HQ50 140 m³/s
- HQ100 170 m³/s
| Date | Runoff [m³/s] |
|---|---|
| 27.04.2024 18:15 | 4.5 |
| 27.04.2024 18:00 | 4.5 |
| 27.04.2024 17:45 | 4.5 |
| 27.04.2024 17:30 | 4.5 |
| 27.04.2024 17:15 | 4.5 |
| 27.04.2024 17:00 | 4.5 |
| 27.04.2024 16:45 | 4.5 |
© Bayerisches Landesamt für Umwelt 2024