

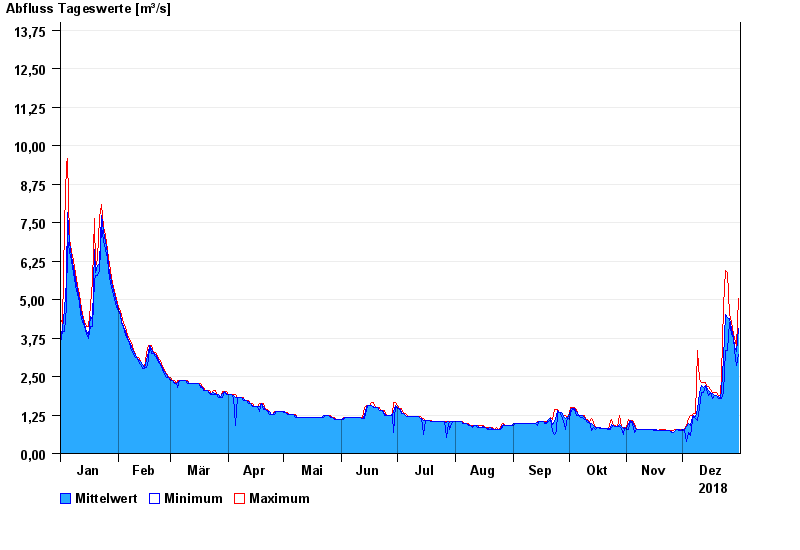
Chart of year Unverzug / Götzinger Achen
Discharge from 01.01.2018 to 31.12.2018
- 08.07.1954 Abfluss: 46,4 m³/s
- 02.06.2013 Abfluss: 29,1 m³/s
- 08.12.1974 Abfluss: 20,3 m³/s
- 31.05.1940 Abfluss: 18,2 m³/s
- 12.08.2002 Abfluss: 18 m³/s
| Date | Mean value [m³/s] | Maximum [m³/s] | Minimum [m³/s] |
|---|---|---|---|
| 31.12.2018 | 4.06 | 5.05 | 3.23 |
| 30.12.2018 | 3.3 | 3.48 | 2.87 |
| 29.12.2018 | 3.49 | 3.73 | 3.35 |
| 28.12.2018 | 3.78 | 3.86 | 3.73 |
| 27.12.2018 | 4.05 | 4.25 | 3.85 |
| 26.12.2018 | 4.37 | 4.51 | 4.25 |
| 25.12.2018 | 4.43 | 5.89 | 3.35 |
© Bayerisches Landesamt für Umwelt 2024