

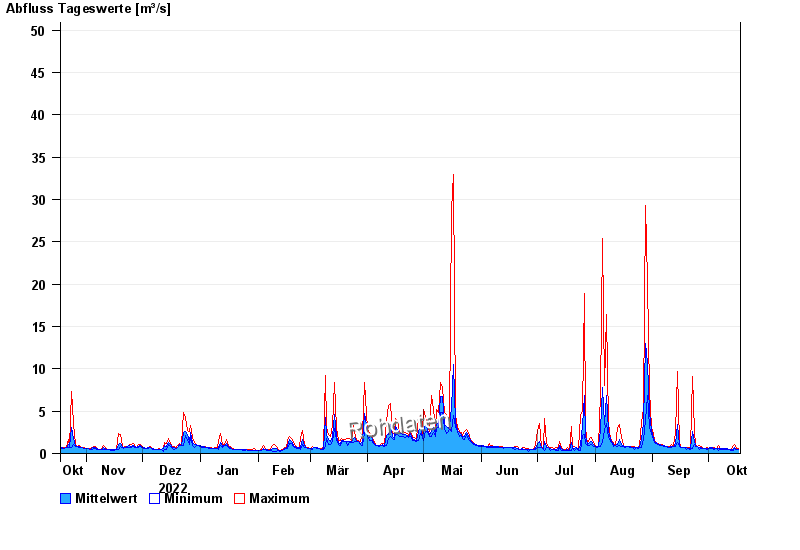
Chart of year Unternogg / Halbammer
Discharge from 18.10.2022 to 17.10.2023
- 21.05.1999 Abfluss: 134 m³/s
- 17.07.1993 Abfluss: 123 m³/s
- 23.08.2005 Abfluss: 92,6 m³/s
- 25.06.1992 Abfluss: 71 m³/s
- 06.08.2000 Abfluss: 66,8 m³/s
| Date | Mean value [m³/s] | Maximum [m³/s] | Minimum [m³/s] |
|---|---|---|---|
| 17.10.2023 | 0.504 | 0.627 | 0.442 |
| 16.10.2023 | 0.523 | 0.577 | 0.442 |
| 15.10.2023 | 0.71 | 1.03 | 0.577 |
| 14.10.2023 | 0.45 | 0.965 | 0.401 |
| 13.10.2023 | 0.414 | 0.442 | 0.401 |
| 12.10.2023 | 0.474 | 0.53 | 0.442 |
| 11.10.2023 | 0.558 | 0.577 | 0.484 |
© Bayerisches Landesamt für Umwelt 2024