

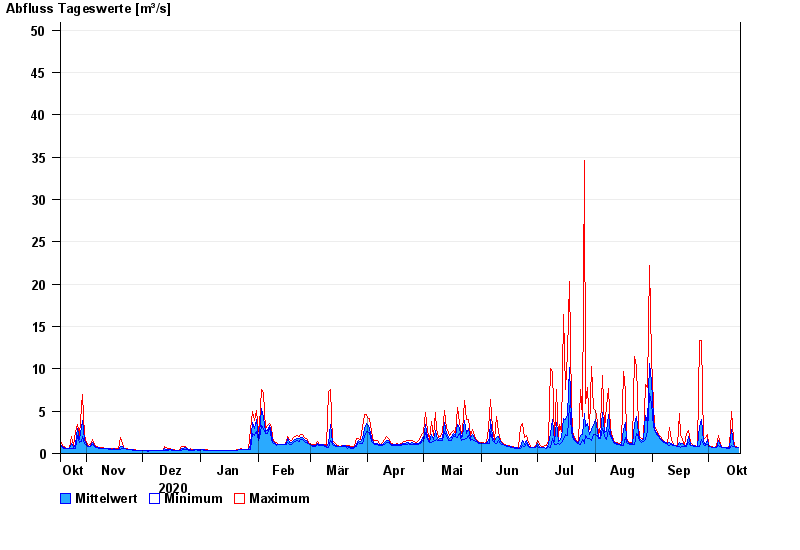
Chart of year Unternogg / Halbammer
Discharge from 18.10.2020 to 17.10.2021
- 21.05.1999 Abfluss: 134 m³/s
- 17.07.1993 Abfluss: 123 m³/s
- 23.08.2005 Abfluss: 92,6 m³/s
- 25.06.1992 Abfluss: 71 m³/s
- 06.08.2000 Abfluss: 66,8 m³/s
| Date | Mean value [m³/s] | Maximum [m³/s] | Minimum [m³/s] |
|---|---|---|---|
| 17.10.2021 | 0.701 | 0.744 | 0.691 |
| 16.10.2021 | 0.751 | 0.8 | 0.691 |
| 15.10.2021 | 0.827 | 0.86 | 0.8 |
| 14.10.2021 | 1.14 | 1.76 | 0.86 |
| 13.10.2021 | 2.86 | 5.01 | 0.99 |
| 12.10.2021 | 0.679 | 0.99 | 0.641 |
| 11.10.2021 | 0.665 | 0.691 | 0.641 |
© Bayerisches Landesamt für Umwelt 2024