

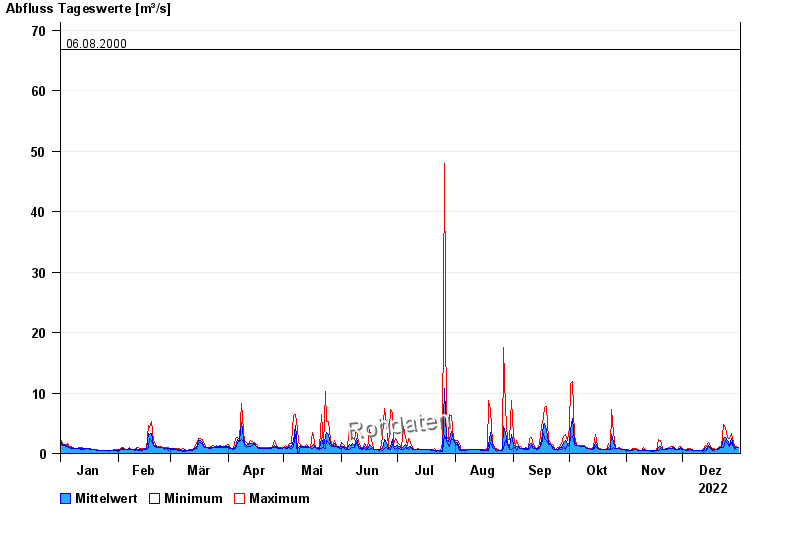
Chart of year Unternogg / Halbammer
Discharge from 01.01.2022 to 31.12.2022
- 21.05.1999 Abfluss: 134 m³/s
- 17.07.1993 Abfluss: 123 m³/s
- 23.08.2005 Abfluss: 92,6 m³/s
- 25.06.1992 Abfluss: 71 m³/s
- 06.08.2000 Abfluss: 66,8 m³/s
| Date | Mean value [m³/s] | Maximum [m³/s] | Minimum [m³/s] |
|---|---|---|---|
| 31.12.2022 | 0.996 | 1 | 0.937 |
| 30.12.2022 | 1.02 | 1.08 | 1 |
| 29.12.2022 | 1.04 | 1.31 | 0.702 |
| 28.12.2022 | 1.34 | 1.88 | 1 |
| 27.12.2022 | 2.49 | 3.35 | 1.88 |
| 26.12.2022 | 1.42 | 2.55 | 1.08 |
| 25.12.2022 | 2.22 | 2.68 | 1.59 |
© Bayerisches Landesamt für Umwelt 2024