

Chart of year Unternogg / Halbammer
Discharge from 01.01.2020 to 31.12.2020
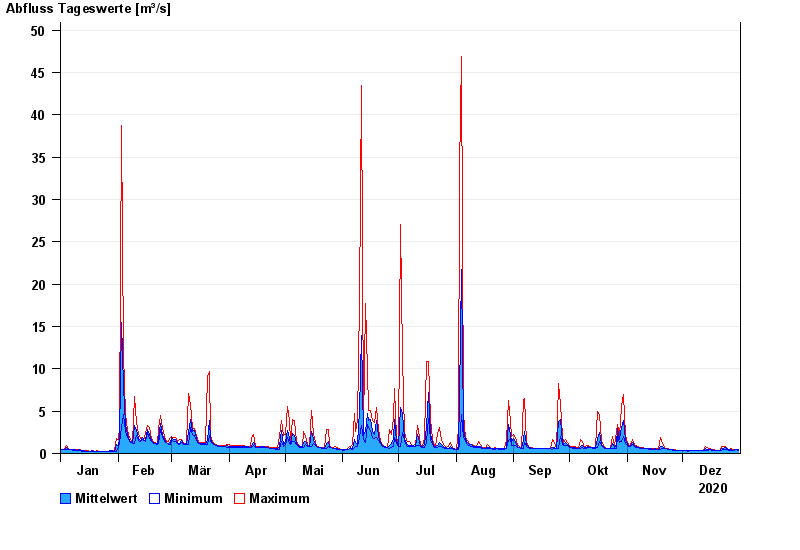
| Date | Mean value [m³/s] | Maximum [m³/s] | Minimum [m³/s] |
|---|---|---|---|
| 31.12.2020 | 0.442 | 0.485 | 0.405 |
| 30.12.2020 | 0.452 | 0.484 | 0.443 |
| 29.12.2020 | 0.443 | 0.484 | 0.366 |
| 28.12.2020 | 0.412 | 0.442 | 0.402 |
| 27.12.2020 | 0.416 | 0.568 | 0.33 |
| 26.12.2020 | 0.444 | 0.481 | 0.365 |
| 25.12.2020 | 0.546 | 0.611 | 0.48 |
© Bayerisches Landesamt für Umwelt 2024