

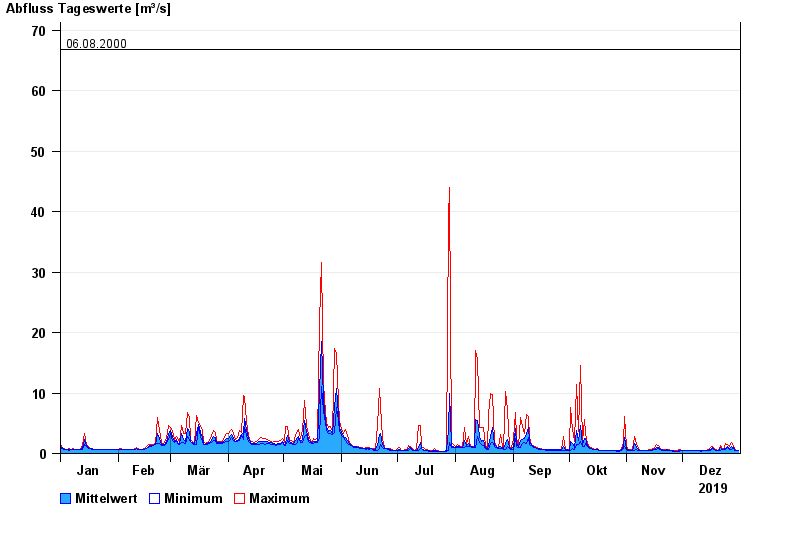
Chart of year Unternogg / Halbammer
Discharge from 01.01.2019 to 31.12.2019
- 21.05.1999 Abfluss: 134 m³/s
- 17.07.1993 Abfluss: 123 m³/s
- 23.08.2005 Abfluss: 92,6 m³/s
- 25.06.1992 Abfluss: 71 m³/s
- 06.08.2000 Abfluss: 66,8 m³/s
| Date | Mean value [m³/s] | Maximum [m³/s] | Minimum [m³/s] |
|---|---|---|---|
| 31.12.2019 | 0.496 | 0.53 | 0.487 |
| 30.12.2019 | 0.524 | 0.577 | 0.487 |
| 29.12.2019 | 0.643 | 0.798 | 0.53 |
| 28.12.2019 | 0.979 | 1.23 | 0.798 |
| 27.12.2019 | 1.08 | 1.86 | 0.628 |
| 26.12.2019 | 0.825 | 1.15 | 0.628 |
| 25.12.2019 | 1.18 | 1.49 | 1 |
© Bayerisches Landesamt für Umwelt 2024