

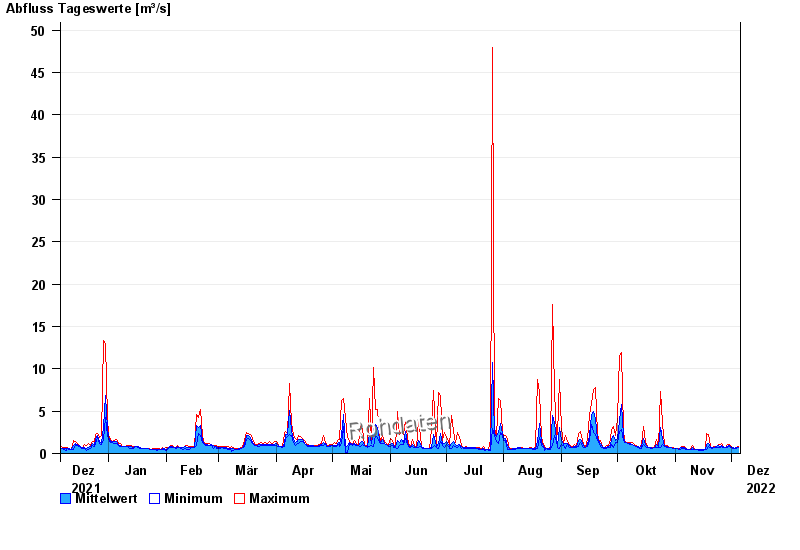
Chart of year Unternogg / Halbammer
Discharge from 06.12.2021 to 05.12.2022
| Date | Mean value [m³/s] | Maximum [m³/s] | Minimum [m³/s] |
|---|---|---|---|
| 05.12.2022 | 0.715 | 0.813 | 0.653 |
| 04.12.2022 | 0.65 | 0.762 | 0.565 |
| 03.12.2022 | 0.575 | 0.61 | 0.565 |
| 02.12.2022 | 0.657 | 0.708 | 0.61 |
| 01.12.2022 | 0.76 | 0.819 | 0.708 |
| 30.11.2022 | 0.944 | 1.09 | 0.819 |
| 29.11.2022 | 0.855 | 1.09 | 0.656 |
© Bayerisches Landesamt für Umwelt 2024