
- Start >
- Rivers >
- Discharge >
- Isar >
- Unterfinning Q >
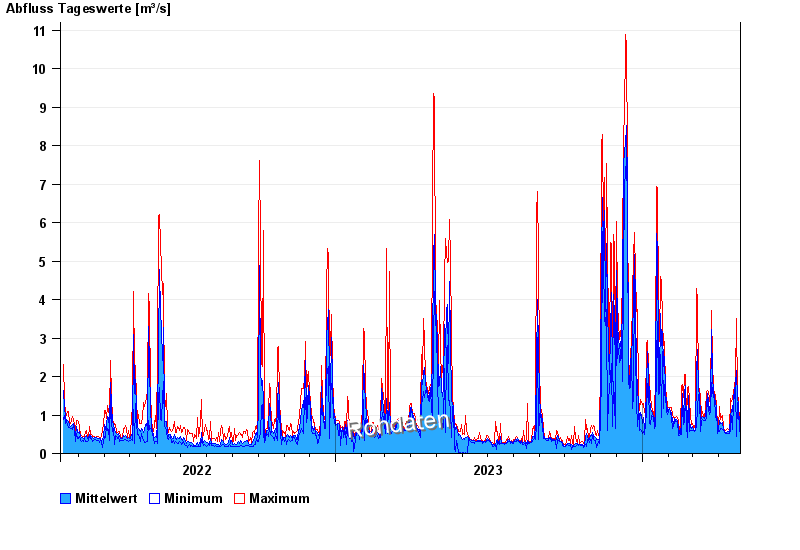
- Chart of total period

Chart of total period Unterfinning Q / Windach
Discharge from 08.02.2022 to 26.04.2024
 Für diesen Pegel sind keine Hauptwerte hinterlegt.
| Date | Mean value [m³/s] | Maximum [m³/s] | Minimum [m³/s] |
|---|---|---|---|
| 26.04.2024 | 0.593 | 0.67 | 0.57 |
| 25.04.2024 | 0.878 | 1.19 | 0.58 |
| 24.04.2024 | 1.32 | 1.45 | 1.17 |
| 23.04.2024 | 1.41 | 1.48 | 1.33 |
| 22.04.2024 | 2.15 | 3.51 | 0.43 |
| 21.04.2024 | 1.81 | 1.95 | 1.72 |
| 20.04.2024 | 1.63 | 1.74 | 1.5 |
© Bayerisches Landesamt für Umwelt 2024