

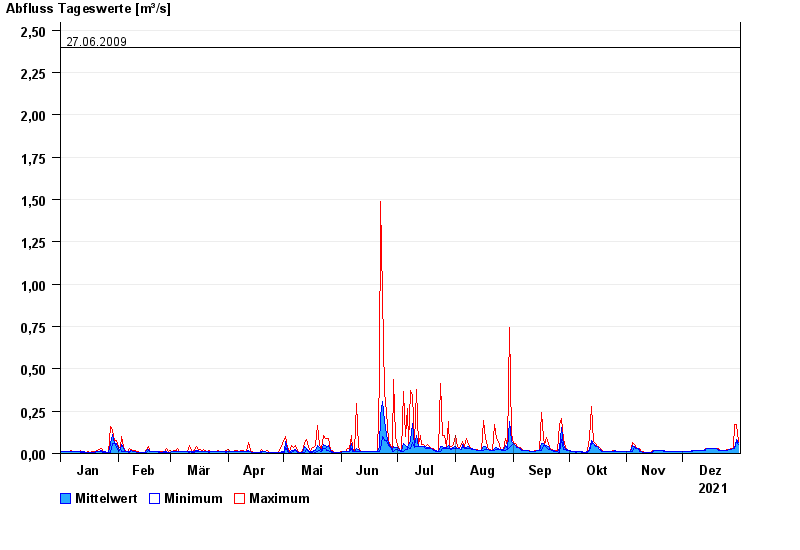
Chart of year Tutzing / Kalkgraben
Discharge from 01.01.2021 to 31.12.2021
- 11.07.1989 Abfluss: 5,32 m³/s
- 18.05.2002 Abfluss: 3,11 m³/s
- 20.07.2004 Abfluss: 2,71 m³/s
- 29.05.2007 Abfluss: 2,53 m³/s
- 27.06.2009 Abfluss: 2,4 m³/s
| Date | Mean value [m³/s] | Maximum [m³/s] | Minimum [m³/s] |
|---|---|---|---|
| 31.12.2021 | 0.065 | 0.07 | 0.054 |
| 30.12.2021 | 0.083 | 0.171 | 0.069 |
| 29.12.2021 | 0.03 | 0.171 | 0.029 |
| 28.12.2021 | 0.029 | 0.029 | 0.029 |
| 27.12.2021 | 0.025 | 0.029 | 0.021 |
| 26.12.2021 | 0.021 | 0.021 | 0.021 |
| 25.12.2021 | 0.02 | 0.021 | 0.02 |
© Bayerisches Landesamt für Umwelt 2024