

Chart of total period Tutzing / Kalkgraben
Discharge from 01.11.1978 to 26.04.2024
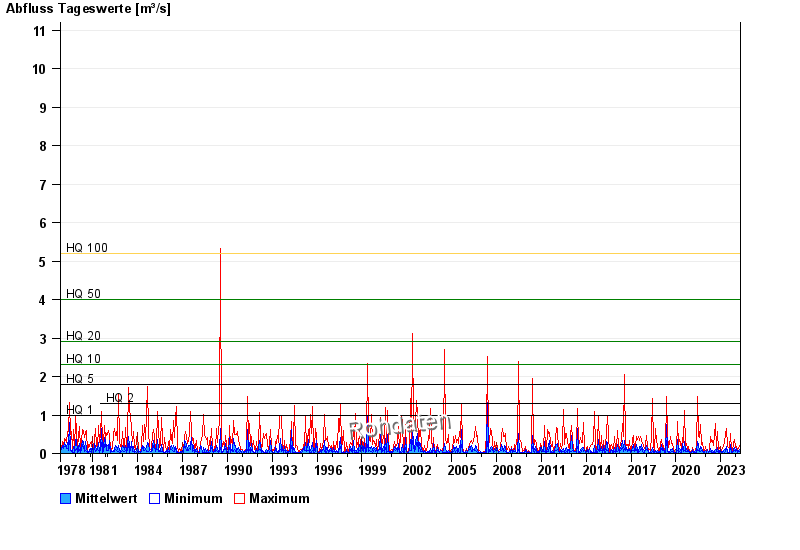
- HQ1 1 m³/s
- HQ2 1,3 m³/s
- HQ5 1,8 m³/s
- HQ10 2,3 m³/s
- HQ20 2,9 m³/s
- HQ50 4 m³/s
- HQ100 5,2 m³/s
| Date | Mean value [m³/s] | Maximum [m³/s] | Minimum [m³/s] |
|---|---|---|---|
| 26.04.2024 | 0.026 | 0.035 | 0.026 |
| 25.04.2024 | 0.032 | 0.035 | 0.026 |
| 24.04.2024 | 0.035 | 0.035 | 0.035 |
| 23.04.2024 | 0.035 | 0.035 | 0.035 |
| 22.04.2024 | 0.039 | 0.048 | 0.035 |
| 21.04.2024 | 0.045 | 0.081 | 0.035 |
| 20.04.2024 | 0.039 | 0.048 | 0.035 |
© Bayerisches Landesamt für Umwelt 2024