
- Start >
- Rivers >
- Discharge >
- Isar >
- Tiefenbach >
- Chart of year

Chart of year Tiefenbach / Tiefenbach
Discharge from 01.01.2024 to 26.04.2024
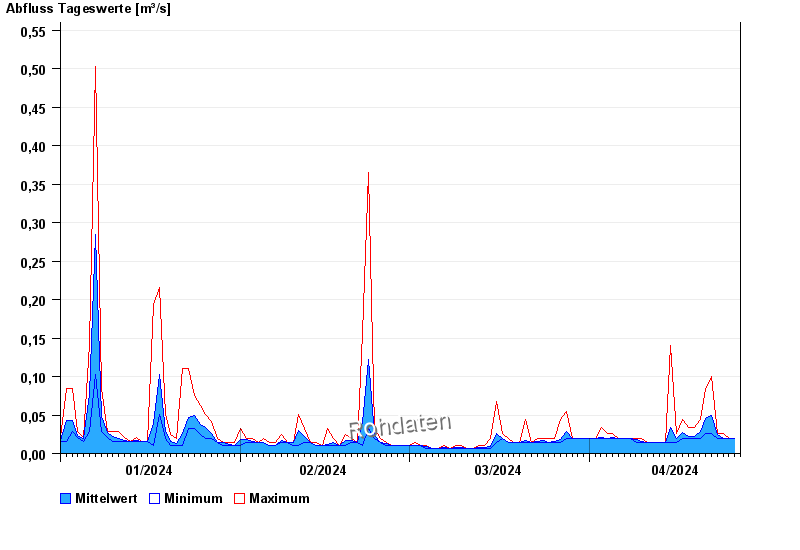
| Date | Mean value [m³/s] | Maximum [m³/s] | Minimum [m³/s] |
|---|---|---|---|
| 26.04.2024 | 0.019 | 0.019 | 0.019 |
| 25.04.2024 | 0.019 | 0.019 | 0.019 |
| 24.04.2024 | 0.02 | 0.026 | 0.019 |
| 23.04.2024 | 0.025 | 0.026 | 0.019 |
| 22.04.2024 | 0.049 | 0.1 | 0.026 |
| 21.04.2024 | 0.046 | 0.083 | 0.026 |
| 20.04.2024 | 0.028 | 0.044 | 0.019 |
© Bayerisches Landesamt für Umwelt 2024