
- Start >
- Rivers >
- Discharge >
- Isar >
- Tiefenbach >
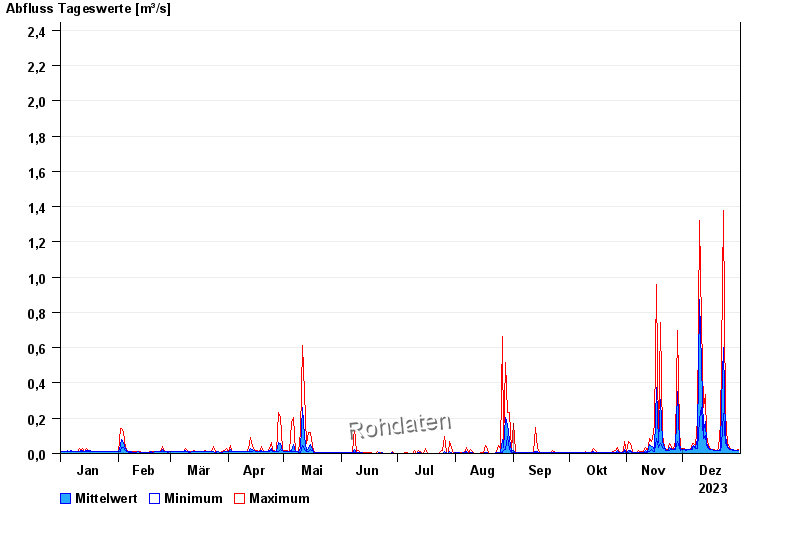
- Chart of year

Chart of year Tiefenbach / Tiefenbach
Discharge from 01.01.2023 to 31.12.2023
- 04.07.1975 Abfluss: 16,9 m³/s
- 28.05.1993 Abfluss: 8,95 m³/s
- 16.02.1990 Abfluss: 7,66 m³/s
- 08.07.1983 Abfluss: 7,4 m³/s
- 02.06.1995 Abfluss: 7,19 m³/s
| Date | Mean value [m³/s] | Maximum [m³/s] | Minimum [m³/s] |
|---|---|---|---|
| 31.12.2023 | 0.017 | 0.021 | 0.016 |
| 30.12.2023 | 0.016 | 0.016 | 0.016 |
| 29.12.2023 | 0.016 | 0.016 | 0.016 |
| 28.12.2023 | 0.021 | 0.021 | 0.016 |
| 27.12.2023 | 0.021 | 0.021 | 0.021 |
| 26.12.2023 | 0.027 | 0.036 | 0.021 |
| 25.12.2023 | 0.041 | 0.057 | 0.036 |
© Bayerisches Landesamt für Umwelt 2024