
- Start >
- Rivers >
- Discharge >
- Isar >
- Teisendorf >
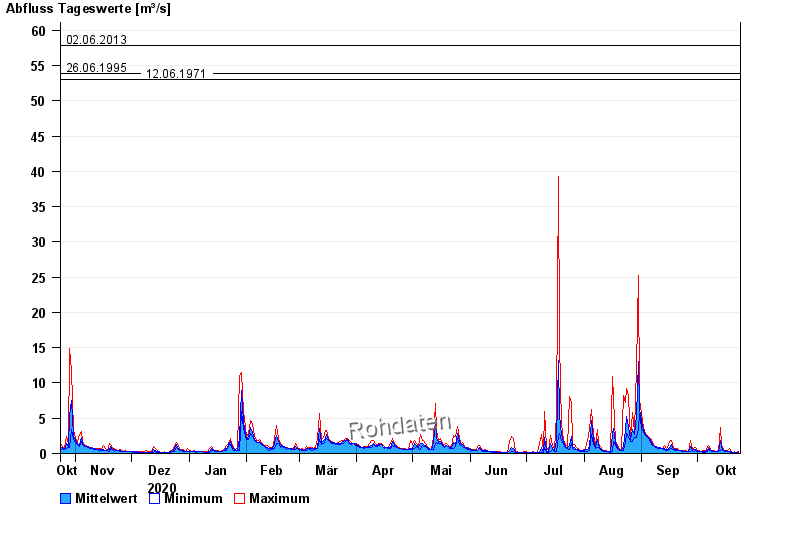
- Chart of year

Chart of year Teisendorf / Sur
Discharge from 24.10.2020 to 23.10.2021
- 04.08.2020 Abfluss: 92 m³/s
- 12.08.2002 Abfluss: 79,6 m³/s
- 02.06.2013 Abfluss: 57,8 m³/s
- 26.06.1995 Abfluss: 53,8 m³/s
- 12.06.1971 Abfluss: 53 m³/s
| Date | Mean value [m³/s] | Maximum [m³/s] | Minimum [m³/s] |
|---|---|---|---|
| 23.10.2021 | 0.169 | 0.23 | 0.162 |
| 22.10.2021 | 0.162 | 0.162 | 0.162 |
| 21.10.2021 | 0.163 | 0.23 | 0.112 |
| 20.10.2021 | 0.169 | 0.193 | 0.093 |
| 19.10.2021 | 0.227 | 0.324 | 0.162 |
| 18.10.2021 | 0.318 | 0.696 | 0.274 |
| 17.10.2021 | 0.334 | 0.376 | 0.324 |
© Bayerisches Landesamt für Umwelt 2024