
- Start >
- Rivers >
- Discharge >
- Isar >
- Teisendorf >
- Chart of year

Chart of year Teisendorf / Sur
Discharge from 21.10.2022 to 20.10.2023
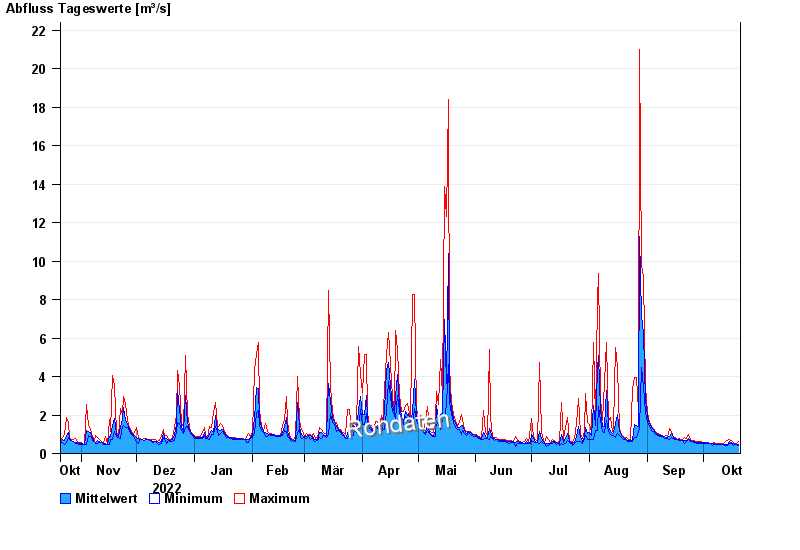
| Date | Mean value [m³/s] | Maximum [m³/s] | Minimum [m³/s] |
|---|---|---|---|
| 20.10.2023 | 0.471 | 0.623 | 0.429 |
| 19.10.2023 | 0.468 | 0.503 | 0.465 |
| 18.10.2023 | 0.487 | 0.503 | 0.465 |
| 17.10.2023 | 0.496 | 0.582 | 0.394 |
| 16.10.2023 | 0.553 | 0.666 | 0.503 |
| 15.10.2023 | 0.602 | 0.753 | 0.503 |
| 14.10.2023 | 0.485 | 0.666 | 0.429 |
© Bayerisches Landesamt für Umwelt 2024