
- Start >
- Rivers >
- Discharge >
- Isar >
- Teisendorf >
- Chart of year

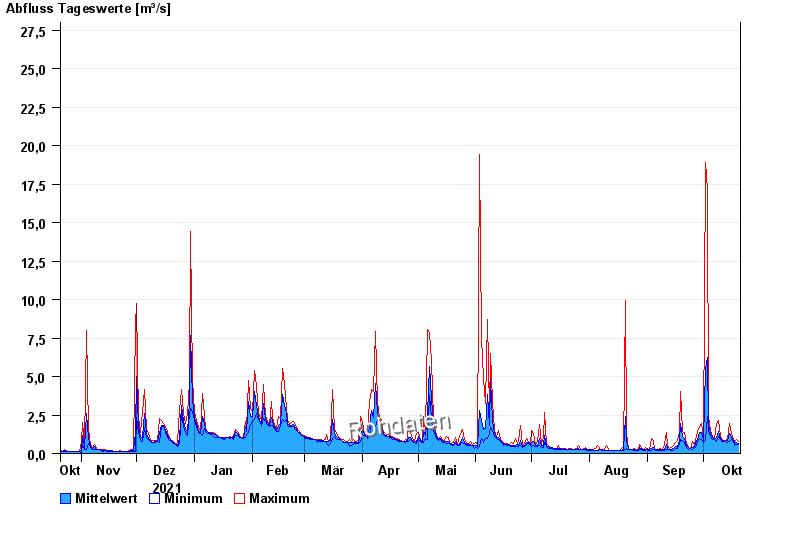
Chart of year Teisendorf / Sur
Discharge from 21.10.2021 to 20.10.2022
- 04.08.2020 Abfluss: 92 m³/s
- 12.08.2002 Abfluss: 79,6 m³/s
- 02.06.2013 Abfluss: 57,8 m³/s
- 26.06.1995 Abfluss: 53,8 m³/s
- 12.06.1971 Abfluss: 53 m³/s
| Date | Mean value [m³/s] | Maximum [m³/s] | Minimum [m³/s] |
|---|---|---|---|
| 20.10.2022 | 0.659 | 0.795 | 0.616 |
| 19.10.2022 | 0.686 | 0.941 | 0.616 |
| 18.10.2022 | 0.702 | 0.749 | 0.532 |
| 17.10.2022 | 0.815 | 0.895 | 0.749 |
| 16.10.2022 | 1.04 | 1.27 | 0.895 |
| 15.10.2022 | 1.31 | 1.95 | 0.749 |
| 14.10.2022 | 0.819 | 0.941 | 0.703 |
© Bayerisches Landesamt für Umwelt 2024