
- Start >
- Rivers >
- Discharge >
- Isar >
- Teisendorf >
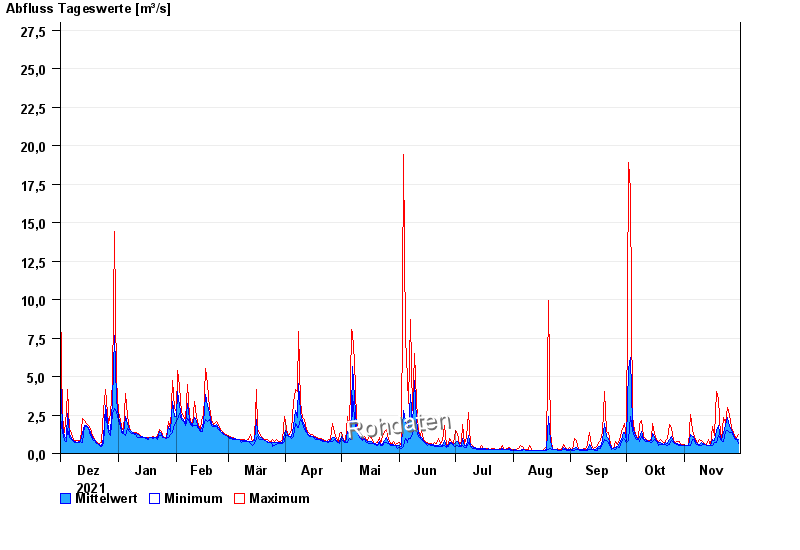
- Chart of year

Chart of year Teisendorf / Sur
Discharge from 01.12.2021 to 30.11.2022
- 04.08.2020 Abfluss: 92 m³/s
- 12.08.2002 Abfluss: 79,6 m³/s
- 02.06.2013 Abfluss: 57,8 m³/s
- 26.06.1995 Abfluss: 53,8 m³/s
- 12.06.1971 Abfluss: 53 m³/s
| Date | Mean value [m³/s] | Maximum [m³/s] | Minimum [m³/s] |
|---|---|---|---|
| 30.11.2022 | 0.896 | 1.21 | 0.659 |
| 29.11.2022 | 0.967 | 0.994 | 0.941 |
| 28.11.2022 | 1.05 | 1.16 | 0.994 |
| 27.11.2022 | 1.26 | 1.34 | 1.16 |
| 26.11.2022 | 1.56 | 1.7 | 1.34 |
| 25.11.2022 | 1.73 | 2.53 | 1.34 |
| 24.11.2022 | 2.37 | 2.96 | 1.47 |
© Bayerisches Landesamt für Umwelt 2024