
- Start >
- Rivers >
- Discharge >
- Isar >
- Sylvenstein >
- Chart of total period

Chart of total period Sylvenstein / Isar
Discharge from 01.11.1949 to 01.05.2024
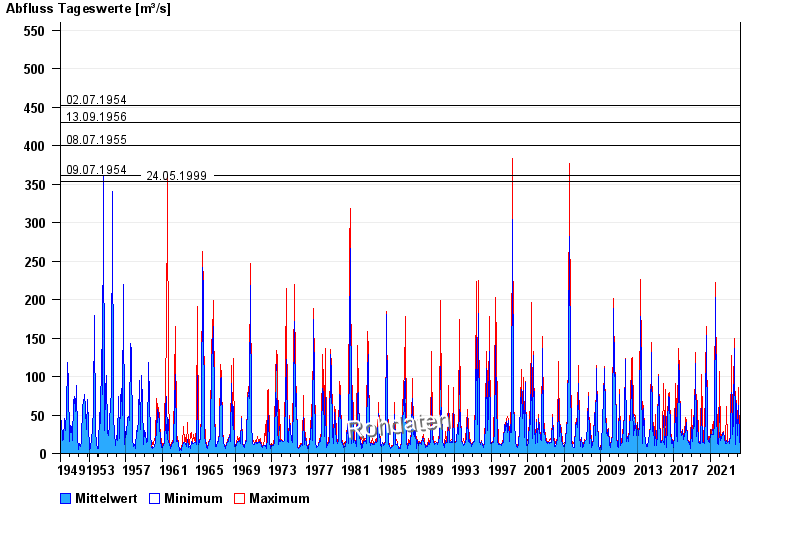
- 02.07.1954 Abfluss: 452 m³/s
- 13.09.1956 Abfluss: 430 m³/s
- 08.07.1955 Abfluss: 400 m³/s
- 09.07.1954 Abfluss: 361 m³/s
- 24.05.1999 Abfluss: 353 m³/s
| Date | Mean value [m³/s] | Maximum [m³/s] | Minimum [m³/s] |
|---|---|---|---|
| 01.05.2024 | 23.1 | 23.6 | 22.8 |
| 30.04.2024 | 31.6 | 63 | 23.6 |
| 29.04.2024 | 23.6 | 23.6 | 23.6 |
| 28.04.2024 | 23 | 24.6 | 20.9 |
| 27.04.2024 | 19.3 | 21.9 | 17.6 |
| 26.04.2024 | 17.9 | 18.4 | 17.6 |
| 25.04.2024 | 15.3 | 17.6 | 11.7 |
© Bayerisches Landesamt für Umwelt 2024