

Chart of year Stegen / Amper
Discharge from 31.07.2019 to 30.07.2020
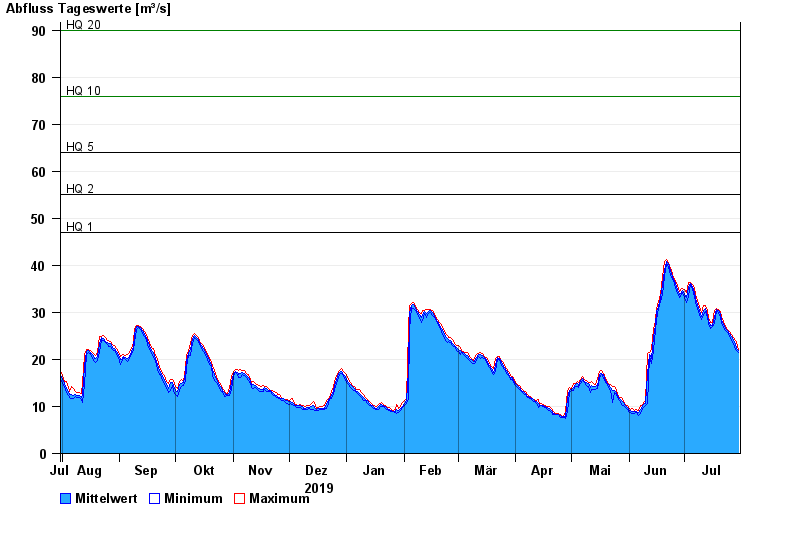
- HQ1 47 m³/s
- HQ2 55 m³/s
- HQ5 64 m³/s
- HQ10 76 m³/s
- HQ20 90 m³/s
- HQ50 112 m³/s
- HQ100 130 m³/s
| Date | Mean value [m³/s] | Maximum [m³/s] | Minimum [m³/s] |
|---|---|---|---|
| 30.07.2020 | 21.8 | 22.2 | 21.4 |
| 29.07.2020 | 22.4 | 23.5 | 21.9 |
| 28.07.2020 | 23.3 | 24.1 | 22.1 |
| 27.07.2020 | 24 | 24.6 | 23.4 |
| 26.07.2020 | 24.8 | 25.2 | 24 |
| 25.07.2020 | 25.5 | 25.9 | 25.1 |
| 24.07.2020 | 26.1 | 26.3 | 25.8 |
© Bayerisches Landesamt für Umwelt 2024