

Chart of year Stegen / Amper
Discharge from 22.11.2019 to 21.11.2020
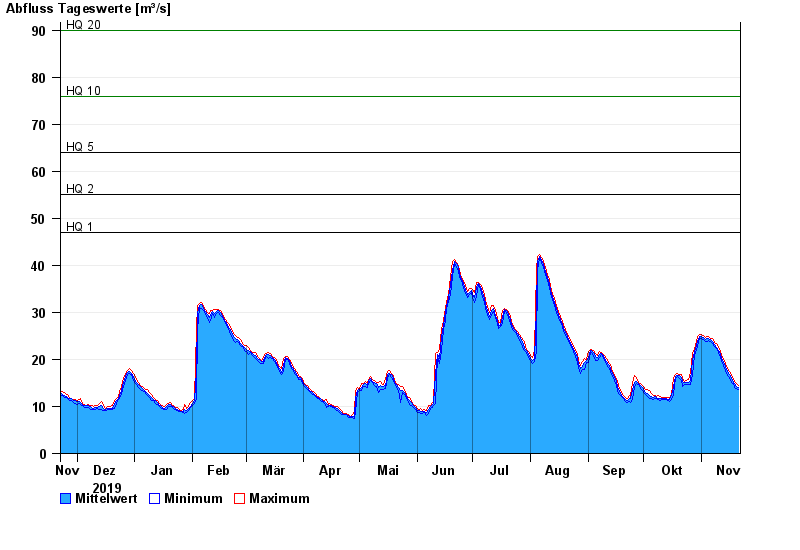
- HQ1 47 m³/s
- HQ2 55 m³/s
- HQ5 64 m³/s
- HQ10 76 m³/s
- HQ20 90 m³/s
- HQ50 112 m³/s
- HQ100 130 m³/s
| Date | Mean value [m³/s] | Maximum [m³/s] | Minimum [m³/s] |
|---|---|---|---|
| 21.11.2020 | 14.1 | 14.5 | 13.7 |
| 20.11.2020 | 14.3 | 14.8 | 13.9 |
| 19.11.2020 | 14.8 | 15.3 | 14.1 |
| 18.11.2020 | 15.2 | 15.7 | 14.8 |
| 17.11.2020 | 15.9 | 16.7 | 15.2 |
| 16.11.2020 | 16.8 | 17.4 | 16.2 |
| 15.11.2020 | 17.5 | 18.1 | 16.6 |
© Bayerisches Landesamt für Umwelt 2024