

Chart of year Staudach / Tiroler Achen
Discharge from 01.01.2023 to 31.12.2023
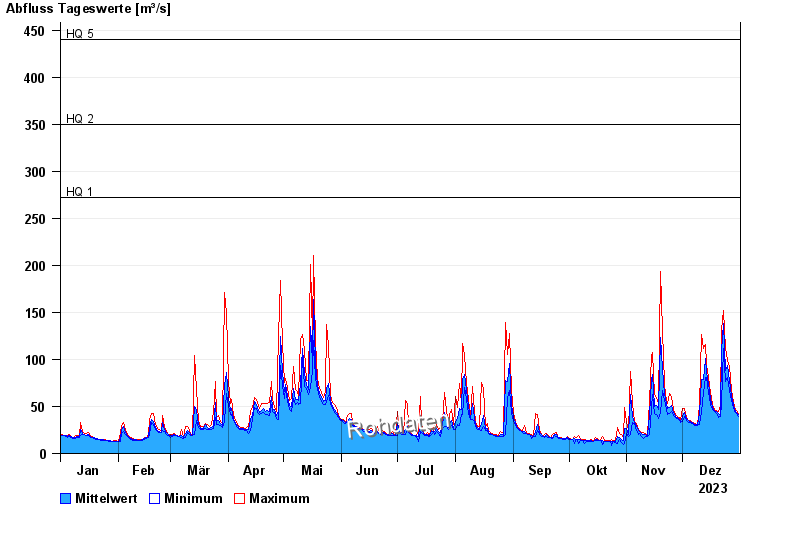
- HQ1 272 m³/s
- HQ2 350 m³/s
- HQ5 440 m³/s
- HQ10 530 m³/s
- HQ20 630 m³/s
- HQ50 760 m³/s
- HQ100 870 m³/s
| Date | Mean value [m³/s] | Maximum [m³/s] | Minimum [m³/s] |
|---|---|---|---|
| 31.12.2023 | 41 | 42.6 | 39.5 |
| 30.12.2023 | 43.9 | 45.9 | 42.6 |
| 29.12.2023 | 47.2 | 49.2 | 45.1 |
| 28.12.2023 | 52 | 55.3 | 49.2 |
| 27.12.2023 | 60.9 | 67.2 | 56.1 |
| 26.12.2023 | 78 | 92.1 | 67.2 |
| 25.12.2023 | 94 | 98.8 | 80.9 |
© Bayerisches Landesamt für Umwelt 2024