

Chart of year Starnberg / Georgenbach
Discharge from 01.01.2020 to 31.12.2020
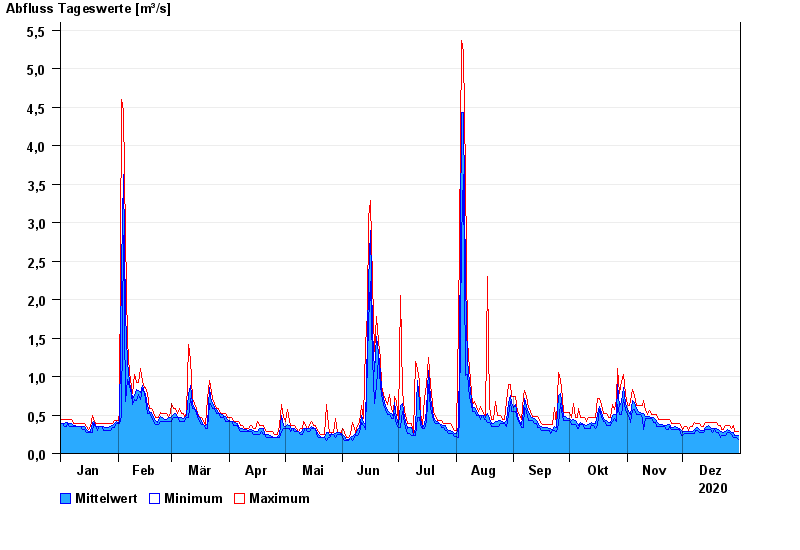
| Date | Mean value [m³/s] | Maximum [m³/s] | Minimum [m³/s] |
|---|---|---|---|
| 31.12.2020 | 0.231 | 0.282 | 0.177 |
| 30.12.2020 | 0.234 | 0.281 | 0.208 |
| 29.12.2020 | 0.24 | 0.281 | 0.207 |
| 28.12.2020 | 0.272 | 0.364 | 0.207 |
| 27.12.2020 | 0.276 | 0.32 | 0.241 |
| 26.12.2020 | 0.296 | 0.362 | 0.278 |
| 25.12.2020 | 0.314 | 0.362 | 0.278 |
© Bayerisches Landesamt für Umwelt 2024