

Chart of year Starnberg / Georgenbach
Discharge from 01.01.2023 to 31.12.2023
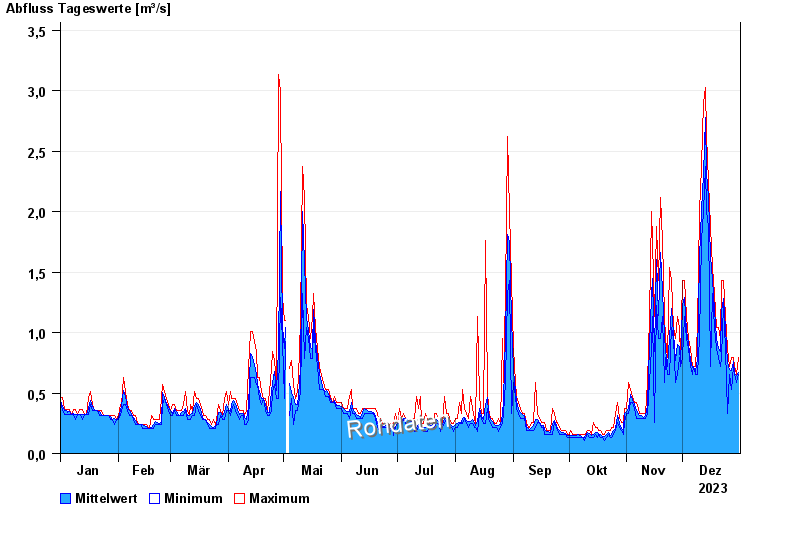
| Date | Mean value [m³/s] | Maximum [m³/s] | Minimum [m³/s] |
|---|---|---|---|
| 31.12.2023 | 0.846 | 0.994 | 0.753 |
| 30.12.2023 | 0.847 | 0.909 | 0.753 |
| 29.12.2023 | 0.874 | 0.909 | 0.829 |
| 28.12.2023 | 0.9 | 0.993 | 0.829 |
| 27.12.2023 | 0.909 | 0.993 | 0.753 |
| 26.12.2023 | 0.968 | 1.08 | 0.908 |
| 25.12.2023 | 1.05 | 1.27 | 0.497 |
© Bayerisches Landesamt für Umwelt 2025