

Chart of year Siegsdorf / Weiße Traun
Discharge from 30.09.2020 to 29.09.2021
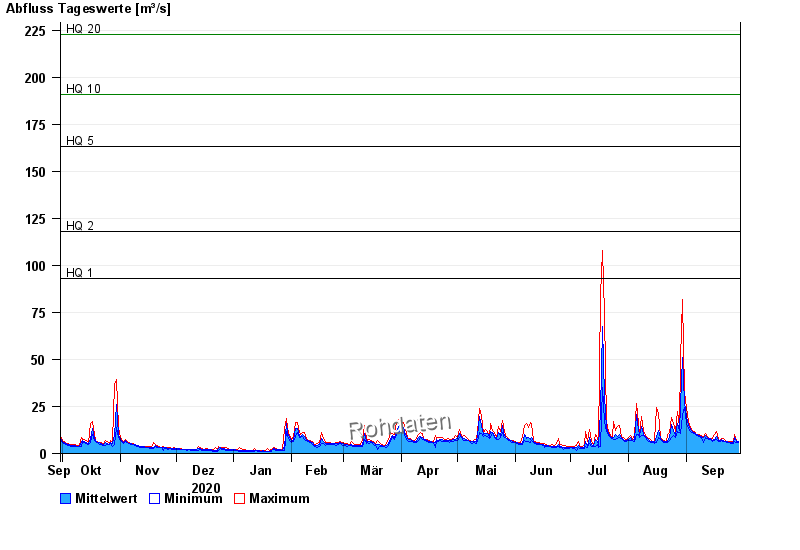
- HQ1 93 m³/s
- HQ2 118 m³/s
- HQ5 163 m³/s
- HQ10 191 m³/s
- HQ20 223 m³/s
- HQ100 300 m³/s
| Date | Mean value [m³/s] | Maximum [m³/s] | Minimum [m³/s] |
|---|---|---|---|
| 29.09.2021 | 6.13 | 6.56 | 5.74 |
| 28.09.2021 | 6.21 | 6.84 | 5.74 |
| 27.09.2021 | 8.33 | 9.92 | 6.56 |
| 26.09.2021 | 5.69 | 6.28 | 5.48 |
| 25.09.2021 | 5.82 | 6.56 | 5.48 |
| 24.09.2021 | 6.09 | 6.56 | 5.74 |
| 23.09.2021 | 6.32 | 6.56 | 6.01 |
© Bayerisches Landesamt für Umwelt 2024