

Chart of total period Siegsdorf / Weiße Traun
Discharge from 01.11.1925 to 27.04.2024
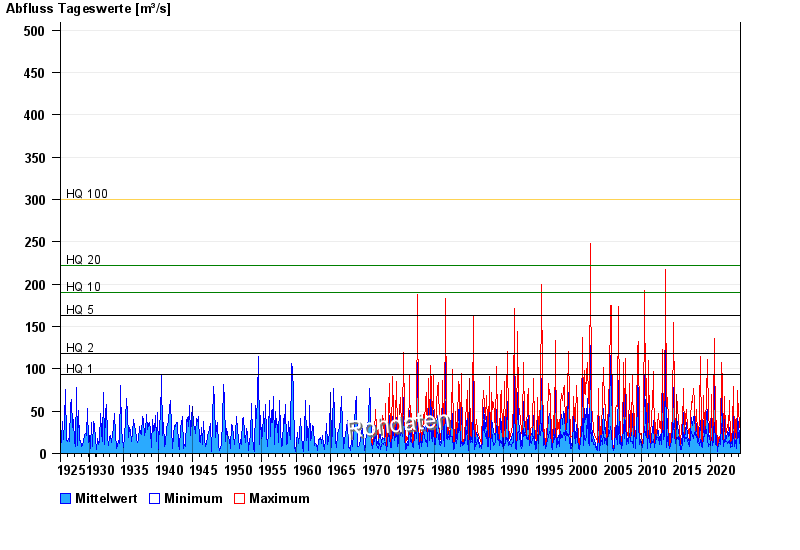
- HQ1 93 m³/s
- HQ2 118 m³/s
- HQ5 163 m³/s
- HQ10 191 m³/s
- HQ20 223 m³/s
- HQ100 300 m³/s
| Date | Mean value [m³/s] | Maximum [m³/s] | Minimum [m³/s] |
|---|---|---|---|
| 27.04.2024 | 9.37 | 9.37 | 9.37 |
| 26.04.2024 | 7.57 | 9.37 | 6.42 |
| 25.04.2024 | 7.39 | 7.96 | 7.03 |
| 24.04.2024 | 7.7 | 8.33 | 7.03 |
| 23.04.2024 | 7.79 | 8.33 | 7.34 |
| 22.04.2024 | 8.77 | 9.75 | 7.96 |
| 21.04.2024 | 9.68 | 10.1 | 8.99 |
© Bayerisches Landesamt für Umwelt 2024