

Chart of year Seebruck / Alz
Discharge from 24.07.2021 to 23.07.2022
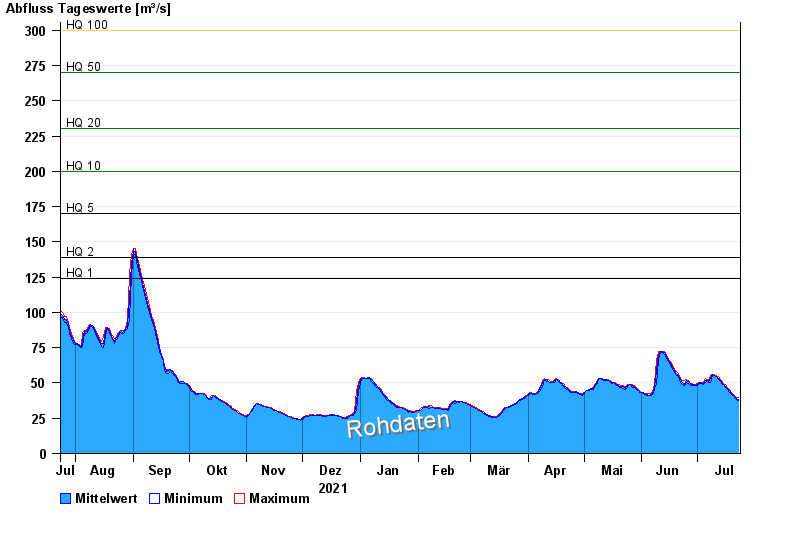
- HQ1 124 m³/s
- HQ2 139 m³/s
- HQ5 170 m³/s
- HQ10 200 m³/s
- HQ20 230 m³/s
- HQ50 270 m³/s
- HQ100 300 m³/s
| Date | Mean value [m³/s] | Maximum [m³/s] | Minimum [m³/s] |
|---|---|---|---|
| 23.07.2022 | 38.3 | 39.4 | 37.8 |
| 22.07.2022 | 39.1 | 39.4 | 38.6 |
| 21.07.2022 | 40.5 | 41.1 | 39.4 |
| 20.07.2022 | 41.7 | 41.9 | 41.1 |
| 19.07.2022 | 42.8 | 43.5 | 41.9 |
| 18.07.2022 | 44.3 | 45.3 | 43.5 |
| 17.07.2022 | 45.9 | 47 | 45.3 |
© Bayerisches Landesamt für Umwelt 2024