

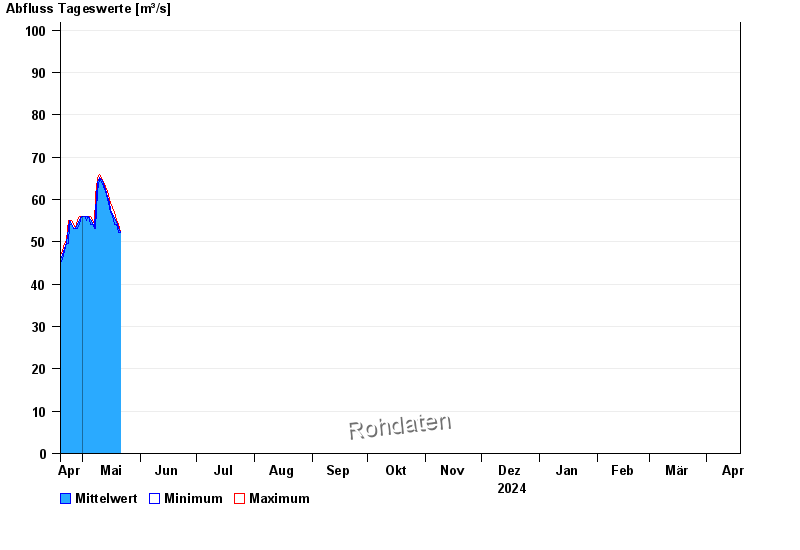
Chart of year Seebruck / Alz
Discharge from 19.04.2024 to 18.04.2025
- 12.06.1965 Abfluss: 312 m³/s
- 03.06.2013 Abfluss: 308 m³/s
- 11.07.1954 Abfluss: 268 m³/s
- 02.06.1940 Abfluss: 225 m³/s
- 20.05.1965 Abfluss: 221 m³/s
| Date | Mean value [m³/s] | Maximum [m³/s] | Minimum [m³/s] |
|---|---|---|---|
| 21.05.2024 | 52.3 | 52.3 | 52.3 |
| 20.05.2024 | 53.5 | 54.1 | 52.3 |
| 19.05.2024 | 54.7 | 55.1 | 54.1 |
| 18.05.2024 | 55.5 | 57 | 54.1 |
| 17.05.2024 | 56.6 | 58 | 56 |
| 16.05.2024 | 57.5 | 59 | 57 |
| 15.05.2024 | 59.2 | 60 | 58 |
© Bayerisches Landesamt für Umwelt 2024