

Chart of year Seebruck / Alz
Discharge from 10.05.2018 to 09.05.2019
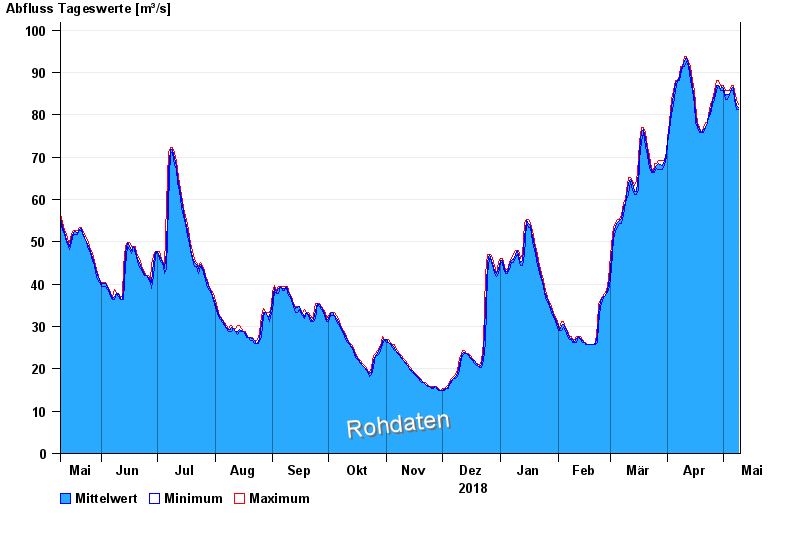
| Date | Mean value [m³/s] | Maximum [m³/s] | Minimum [m³/s] |
|---|---|---|---|
| 09.05.2019 | 81.7 | 82.5 | 81.3 |
| 08.05.2019 | 82.3 | 83.6 | 81.3 |
| 07.05.2019 | 84.4 | 85.8 | 83.6 |
| 06.05.2019 | 86.5 | 86.9 | 85.8 |
| 05.05.2019 | 86.3 | 86.9 | 85.8 |
| 04.05.2019 | 84.7 | 85.8 | 84.7 |
| 03.05.2019 | 84.7 | 85.8 | 83.6 |
© Bayerisches Landesamt für Umwelt 2024