

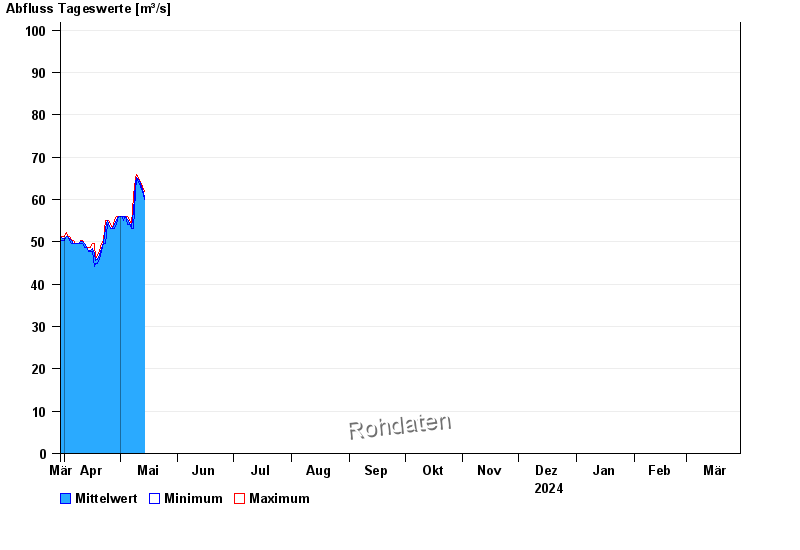
Chart of year Seebruck / Alz
Discharge from 30.03.2024 to 29.03.2025
- 12.06.1965 Abfluss: 312 m³/s
- 03.06.2013 Abfluss: 308 m³/s
- 11.07.1954 Abfluss: 268 m³/s
- 02.06.1940 Abfluss: 225 m³/s
- 20.05.1965 Abfluss: 221 m³/s
| Date | Mean value [m³/s] | Maximum [m³/s] | Minimum [m³/s] |
|---|---|---|---|
| 16.05.2024 | 58.1 | 59 | 58 |
| 15.05.2024 | 59.2 | 60 | 58 |
| 14.05.2024 | 60.8 | 62 | 60 |
| 13.05.2024 | 62.4 | 63 | 62 |
| 12.05.2024 | 63.7 | 64 | 63 |
| 11.05.2024 | 64.7 | 65 | 64 |
| 10.05.2024 | 65.2 | 66 | 65 |
© Bayerisches Landesamt für Umwelt 2024