

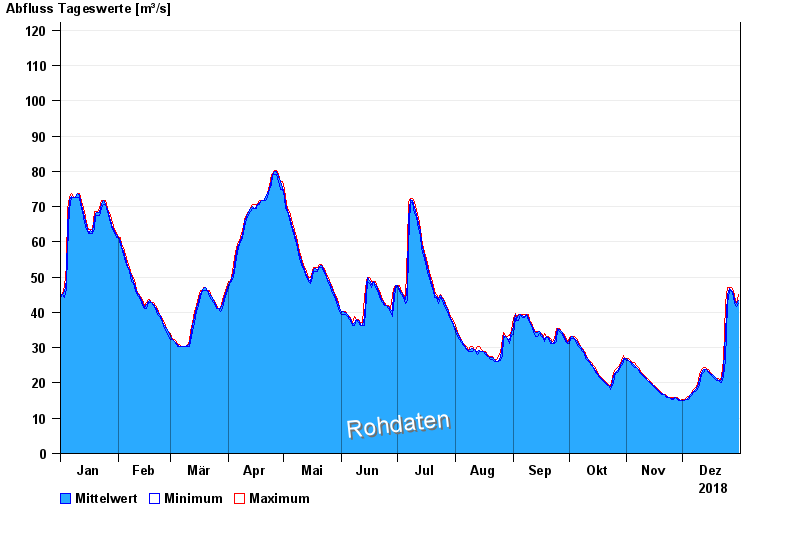
Chart of year Seebruck / Alz
Discharge from 01.01.2018 to 31.12.2018
- 12.06.1965 Abfluss: 312 m³/s
- 03.06.2013 Abfluss: 308 m³/s
- 11.07.1954 Abfluss: 268 m³/s
- 02.06.1940 Abfluss: 225 m³/s
- 20.05.1965 Abfluss: 221 m³/s
| Date | Mean value [m³/s] | Maximum [m³/s] | Minimum [m³/s] |
|---|---|---|---|
| 31.12.2018 | 43.5 | 45.2 | 42.6 |
| 30.12.2018 | 42.6 | 42.6 | 41.8 |
| 29.12.2018 | 43.3 | 44.4 | 42.6 |
| 28.12.2018 | 45 | 46.1 | 44.4 |
| 27.12.2018 | 46.2 | 47 | 46.1 |
| 26.12.2018 | 46.9 | 47 | 46.1 |
| 25.12.2018 | 45.1 | 47 | 42.6 |
© Bayerisches Landesamt für Umwelt 2024