
- Start >
- Rivers >
- Discharge >
- Isar >
- Rottersdorf >
- Chart of year

Chart of year Rottersdorf / Vils
Discharge from 30.07.2021 to 29.07.2022
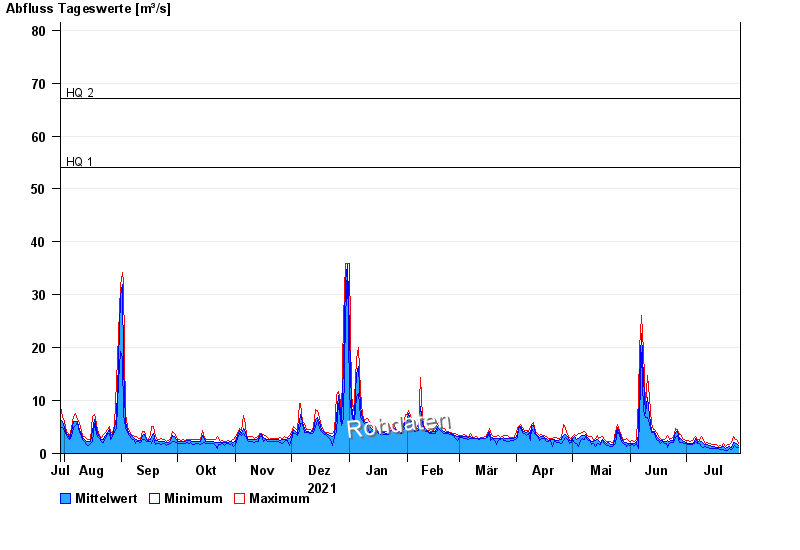
- HQ1 54 m³/s
- HQ2 67 m³/s
- HQ5 85 m³/s
- HQ10 98 m³/s
- HQ20 110 m³/s
| Date | Mean value [m³/s] | Maximum [m³/s] | Minimum [m³/s] |
|---|---|---|---|
| 29.07.2022 | 1.5 | 1.9 | 1.09 |
| 28.07.2022 | 1.92 | 2.65 | 1.18 |
| 27.07.2022 | 2.13 | 2.91 | 1.57 |
| 26.07.2022 | 2.08 | 3.2 | 1.18 |
| 25.07.2022 | 1.18 | 2.14 | 0.691 |
| 24.07.2022 | 1.34 | 1.69 | 0.915 |
| 23.07.2022 | 1.1 | 1.61 | 0.641 |
© Bayerisches Landesamt für Umwelt 2024